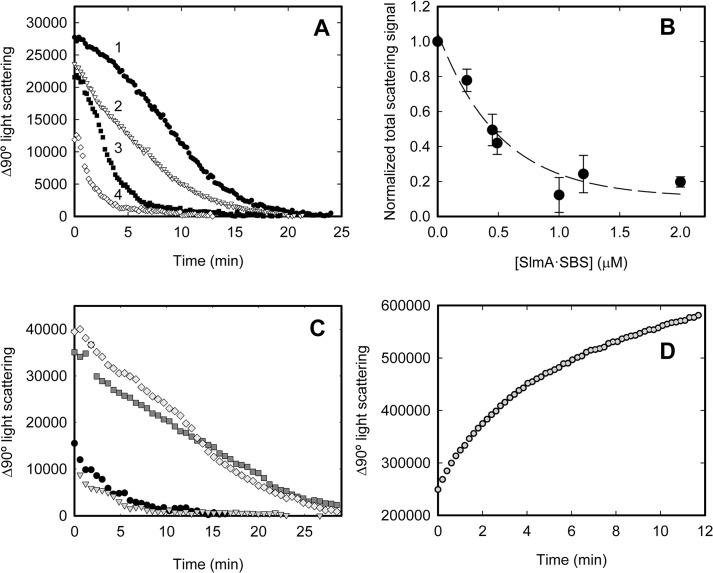
Fig 3. Depolymerization of FtsZ-GTP protofilaments in the absence and presence of SlmA or SlmA SBS and behavior of FtsZ-GMPCPP polymers monitored by static light scattering at 90°.
A. Representative depolymerization profiles of FtsZ (12 μM) in the absence (trace 1) or presence of SlmA:SBScons 2:0.25 (trace 2), 5:0.5 (trace 3) and 5:1 μM (trace 4). B. Dependence of the normalized total scattering signal on the concentration of the SlmA SBS complex, calculated using the binding parameters in Table 1and BIOEQS software. The area under the scattering curves shown in A was calculated and normalized with respect to that obtained in the absence of SlmA SBS (trace 1). Values shown represent the average of at least 3 independent measurements ± SD and dashed line is only intended to guide the eye. C. Depolymerization traces in the absence (grey diamonds) or presence of SlmA (10 μM, dark grey squares), and those obtained upon addition of SlmA:SBScons (10 μM:2 μM) before (solid circles) or after triggering FtsZ polymerization with GTP (grey triangles). D. Evolution of the 90° static light scattering signal of FtsZ-GMPCPP polymers (12 μM FtsZ, 0.4 μM GMPCPP) in the presence of SlmA SBScons (10 μM:2 μM). Experiments were conducted in working buffer at 20°C.

