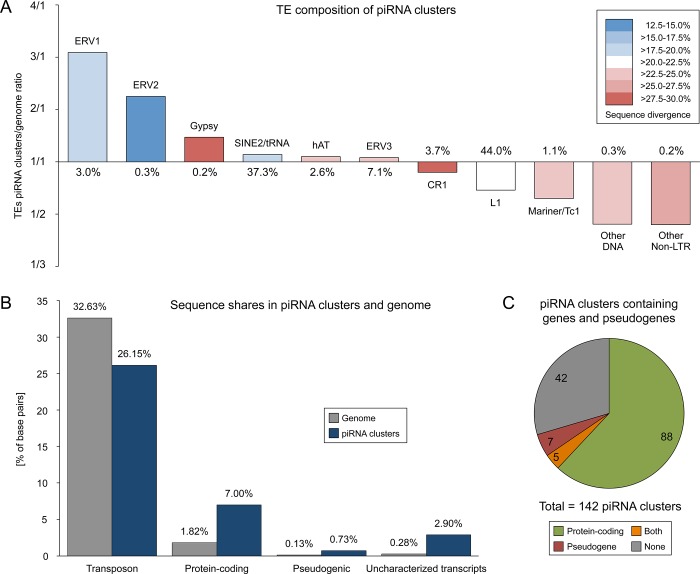
Fig 5. Sequence characterization of piRNA clusters.
(A) TE composition of predicted piRNA clusters compared to the genomic sequence of the pig. Percentages represent the share of a TE group in the genome. A ratio above 1 indicates an enrichment of a TE group in piRNA clusters, while a ratio below 1 indicates the depletion of a TE group in piRNA clusters. Different colors express the sequence divergence of a TE group to its consensus. (B) Sequence shares of TEs, protein-coding genes, pseudogenes, and uncharacterized transcribed sequences within piRNA clusters compared to the whole genome of the pig. (C) Number of piRNA clusters containing sequences of protein-coding genes, pseudogenes or both within the same piRNA cluster.

