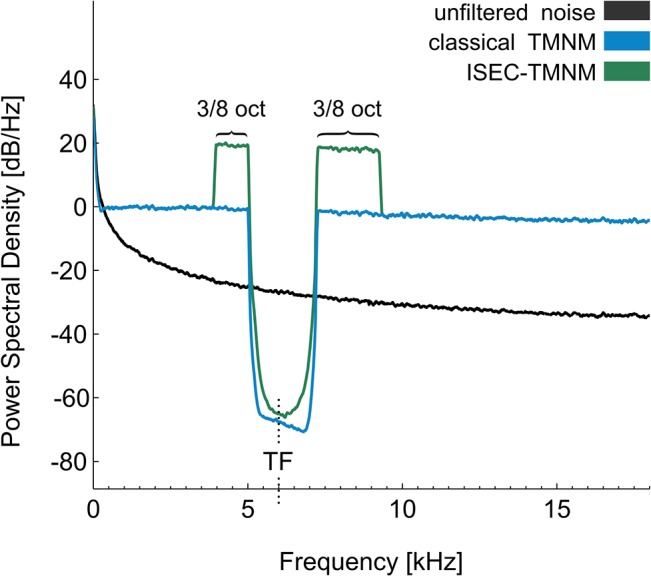
Fig 2. Power spectral density of Brownian noise filtered with both procedures.

Brownian noise was chosen to illustrate the filter procedure, as it resembles the typical energy spectrum of music (lower energy in higher frequencies, 1/f behavior). Black line: frequency spectrum of Brownian noise with 3 s duration. Blue line: frequency spectrum of 3 s of Brownian noise filtered with the applied online filter for classical tailor-made notched music (TMNM). First, spectral energy was re-distributed from low to high frequency ranges (“flattening”). Second, a frequency band of 1/2 octave width centered at 6 kHz was removed from the energy spectrum of Brownian noise (classical TMNM). Green line: frequency spectrum of 3 s of Brownian noise filtered with the applied online filter for increased spectral energy contrast TMNM (ISEC-TMNM). In addition to the filtering procedure of classical TMNM, 3/8 octaves bandwidth of the edge frequency bands around the notch were amplified by 20 dB.
