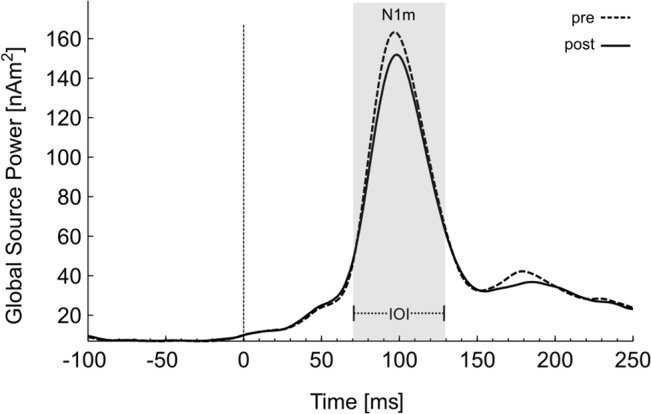
Fig 3. Global source power plot of the source waveforms averaged across all subjects.

Neural activities evoked by the tinnitus tone pre (dotted line) and post (solid line) tailor-made notched music (TMNM) exposure. The a priori N1 time interval of interest (IOI) is highlighted in grey.
