
Fig 5. Results for the interaction effect Session x Group.
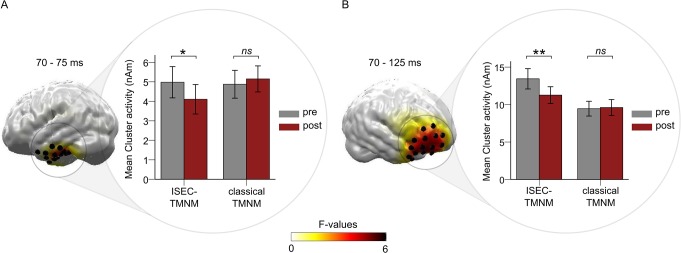
A: left part depicts Statistical Parametric Maps of F-values for the interaction effect Session (pre vs. post tailor-made notched music (TMNM) exposure) x Group (increased spectral energy contrast (ISEC) vs. classical TMNM) in an inferior temporal (B: frontal) cluster. Only spatiotemporal clusters which survived the cluster-based permutation test are colorized. Black cylinders reflect the source locations within the significant clusters. The right part framed with a circle disentangles the direction of the interaction effect by depicting the mean activity evoked by the tinnitus tone before and after TMNM exposure within the significant inferior temporal (B: frontal) cluster for each group individually. Error bars denote one standard error of the mean. Stars denote significance values of pairwise t-tests disentangling the interaction effect (** = p <. 01, * = p <. 05, ns = non-significant).