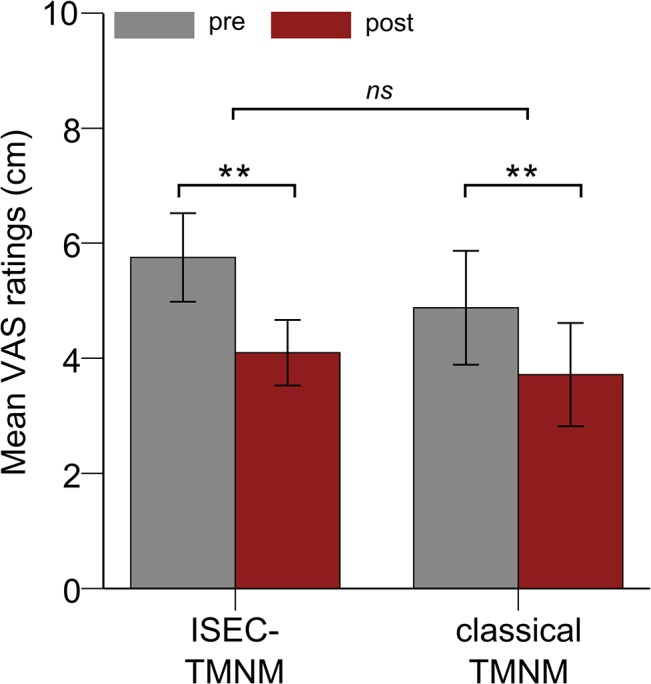
Fig 6. Tinnitus loudness ratings.

Averaged ratings (across all three days) on a visual analog scale (VAS) of the subjectively perceived tinnitus loudness before (grey bar) and after (red bar) tailor-made notched music (TMNM) exposure for the increased spectral energy (ISEC) TMNM (left) and the classical TMNM (right) group. Error bars denote one standard error of the mean. Stars denote significance values of F-test depicting a significant main effect (** = p <. 01) of Session (pre vs. post music exposure) and a non-significant (ns) interaction effect Session x Group.
