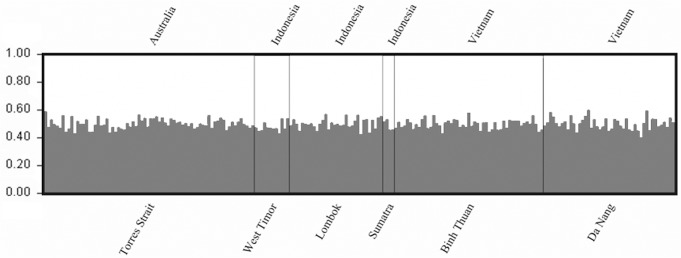
Fig 3. Bayesian individual assignment analysis for K = 2 for Panulirus ornatus genotyped at ten microsatellites across six Indo-Pacific sampling sites.

Colours (grey or white) represent probability (y-axis) of individuals being assigned to each genetic cluster, whilst numbers (x-axis) represents population individuals sampled from 1 = Torres Strait, 2 = West Timor, 3 = Lombok, 4 = North Sumatra, 5 = Binh Thuan (Vietnam), 6 = Da Nang (Vietnam). Sampling locations were used as priors.
