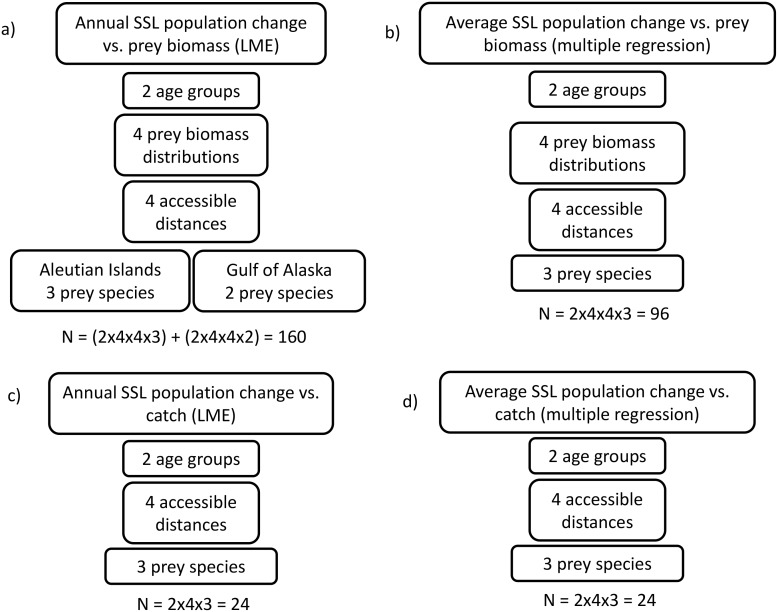
Fig 3. Statistical model types and derivations used to test the relationship between sea lion population change and prey abundance (a and b); and between sea lion population change and fisheries catch (c and d).
Multiple regression and linear mixed-effects models (LME) were used to test for relationships between different age groups of Steller sea lions (SSL), prey biomass distributions, catch, accessible distances and regions. Derivation of the number omodels (N) analysed with each different combination is shown.

