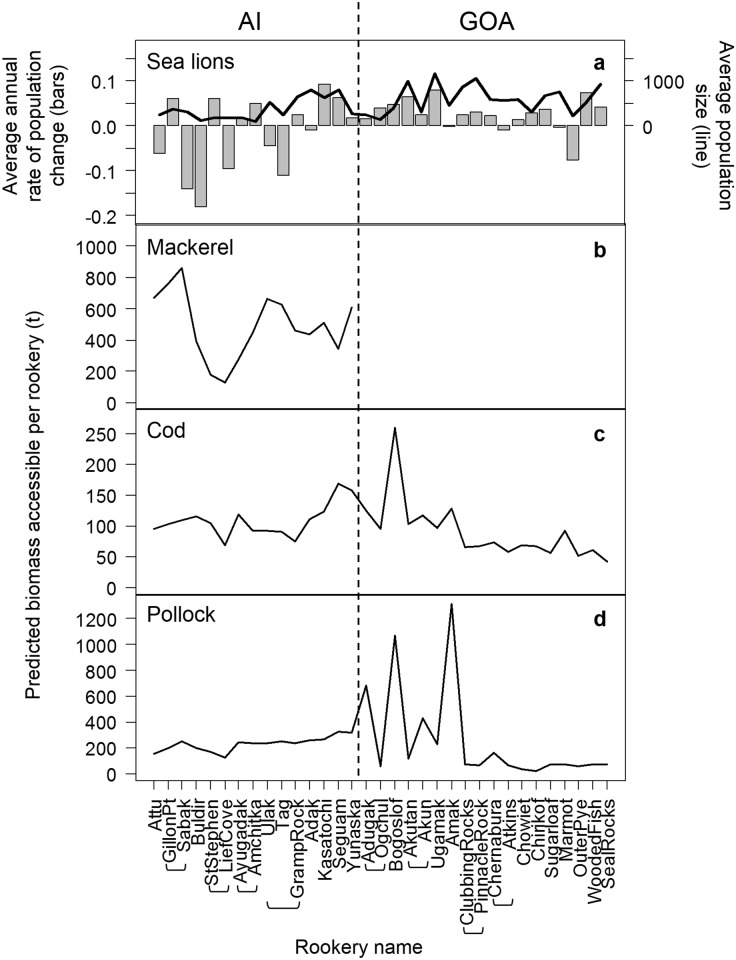
Fig 5. Sea lion population change and the biomass of prey accessible to sea lions.
The average numbers of Steller sea lions (age 1+ y), annual rate of sea lion population change and predicted biomass of groundfish accessible (calculated according to our accessibility model) to sea lions at each rookery or rookery cluster (shown with brackets): (a) Average non-pup population change and population size from 2000–2008, (b) average biomass of Atka mackerel accessible, (c) average biomass of Pacific cod accessible; and (d) average biomass of walleye pollock accessible. Biomasses averages are for 2000/2002/2004 in the Aleutian Islands (AI) and 2001/2003 in the Gulf of Alaska (GOA). Mackerel surveys are not conducted in the Bering Sea and Gulf of Alaska as the species’ distribution is limited in those regions.

