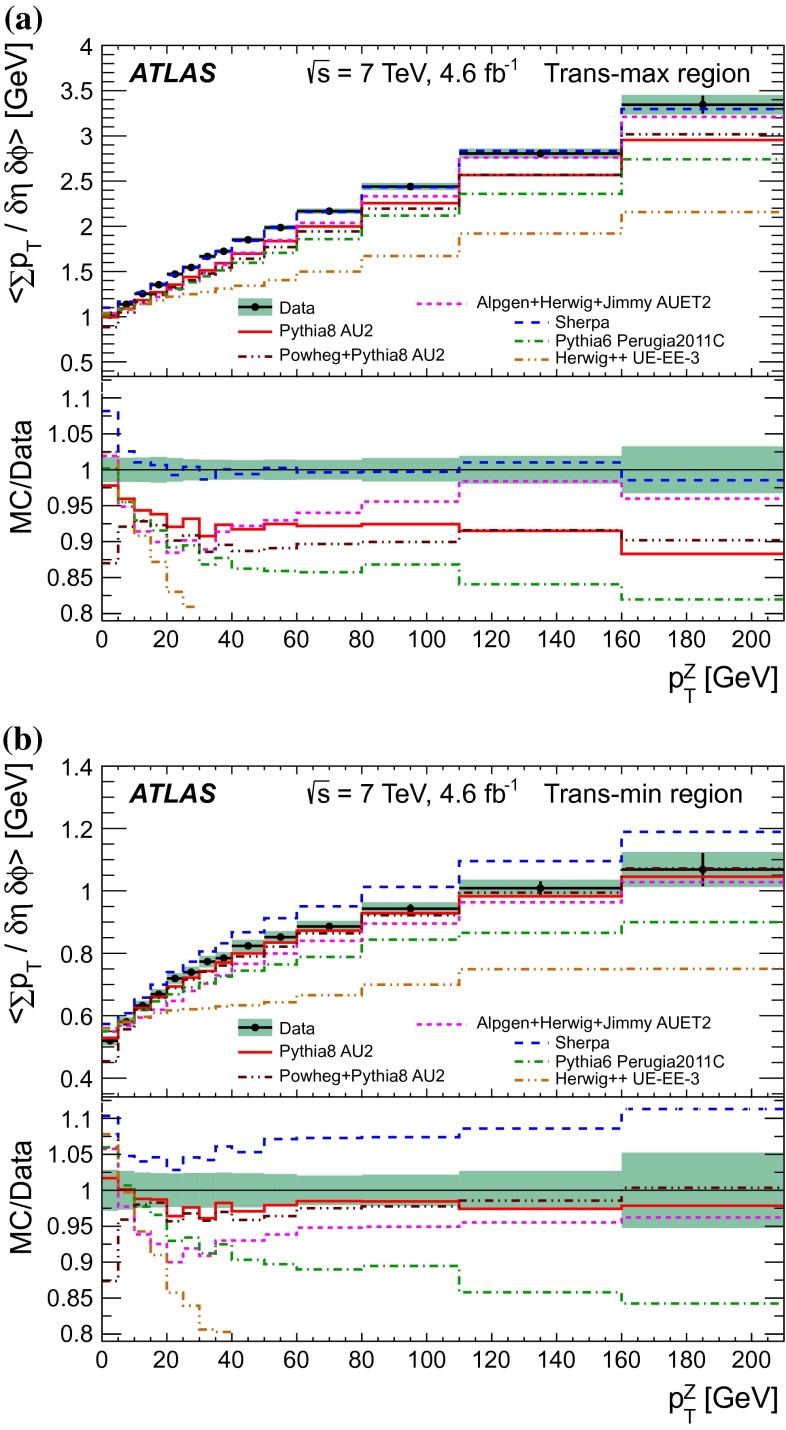
Fig. 15.
Comparison of data and MC predictions for charged particle scalar density average values, , as a function of -boson transverse momentum, , in the trans-max (a) and trans-min (b) regions. The shaded bands represent the combined statistical and systematic uncertainties, while the error bars show the statistical uncertainties

