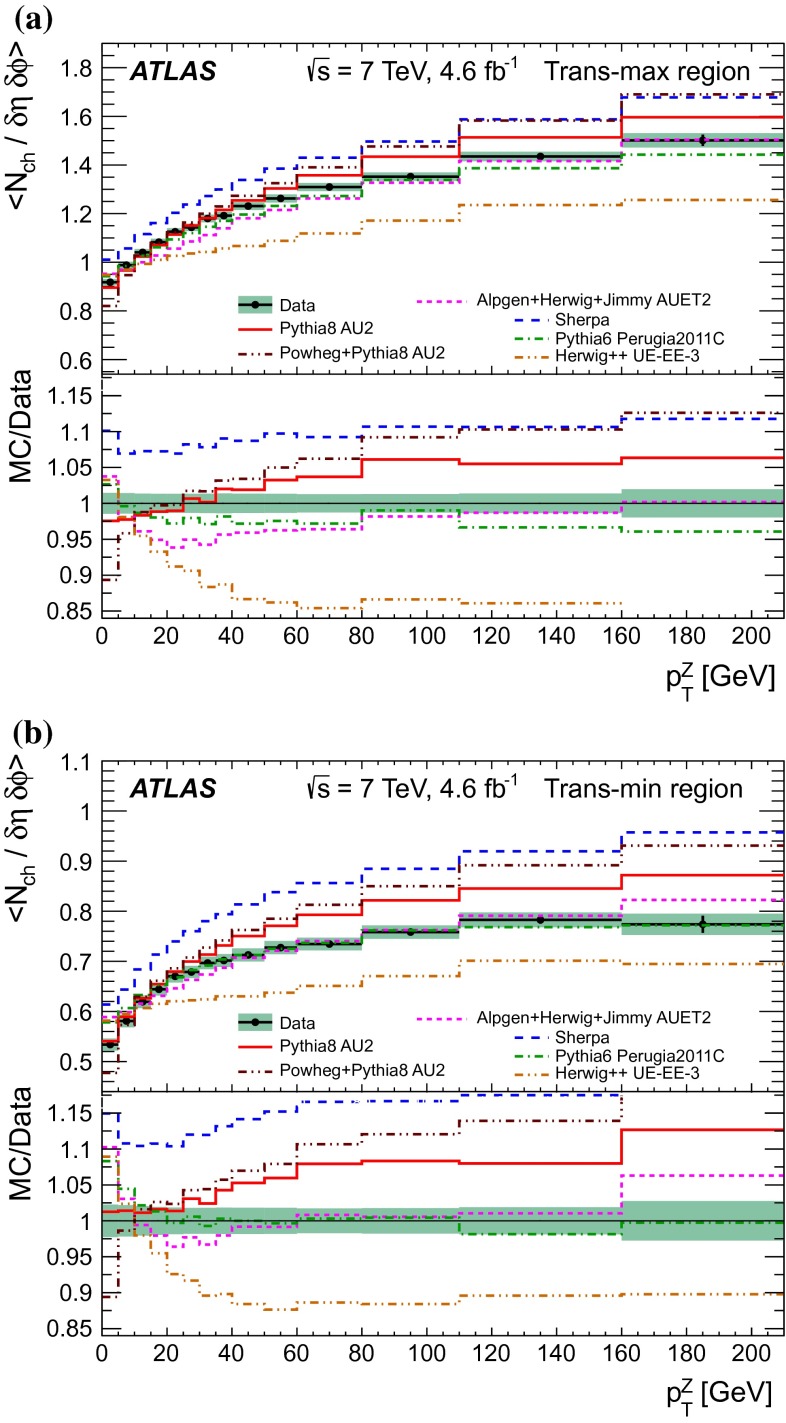
Fig. 18.
Comparison of data and MC predictions for charged particle multiplicity density average values, , as a function of -boson transverse momentum, , in the trans-max (a) and trans-min (b) regions. The bottom panels in each plot show the ratio of MC predictions to data. The shaded bands represent the combined statistical and systematic uncertainties, while the error bars show the statistical uncertainties

