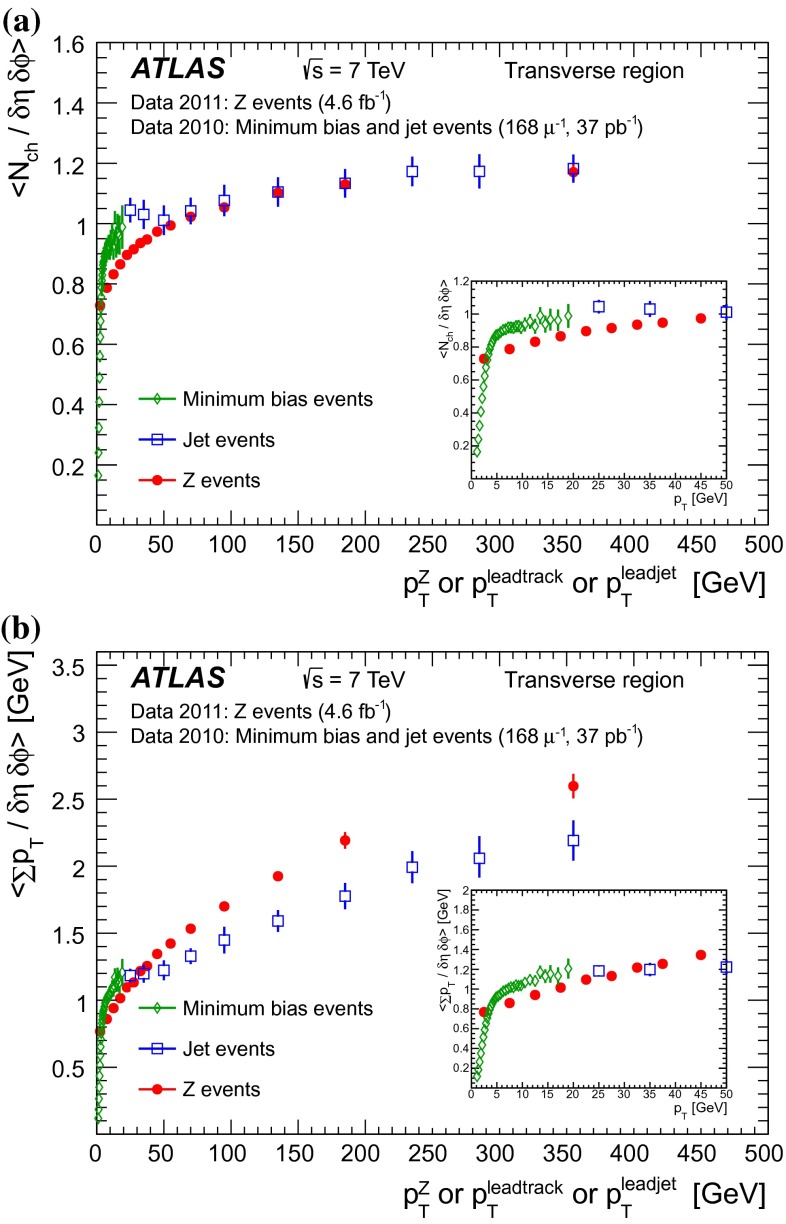
Fig. 24.
Charged particle multiplicity average values, (a), and scalar density average values, (b), compared between leading charged particle (minimum bias), leading jet and -boson events, respectively as functions of leading track transverse momentum, , leading jet transverse momentum, and -boson transverse momentum, , in the transverse region. The error bars in each case show the combined statistical and systematic uncertainties. The insets show the region of transition between the leading charged particle and leading jet results in more detail

