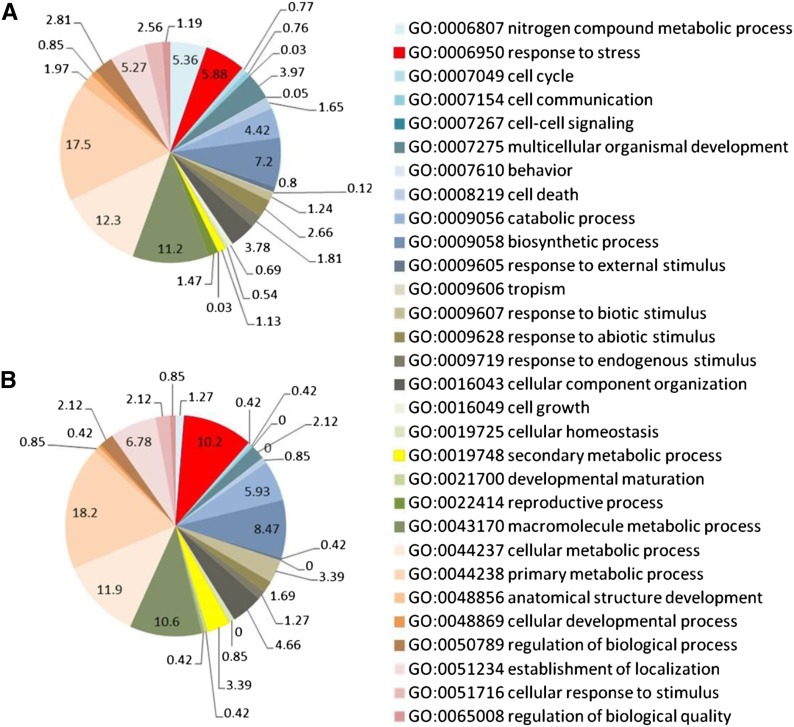
Figure 2.
Distribution of grape genes based on GO slim classification. A, Functional classifications for all microarray genes (n = 29,549). B, Functional classifications for up-regulated genes (n = 238) by UV-C irradiation. For illustration purposes only, Biological Process level 3 ontology terms were selected. Values indicate the percentage of each GO category in total.

