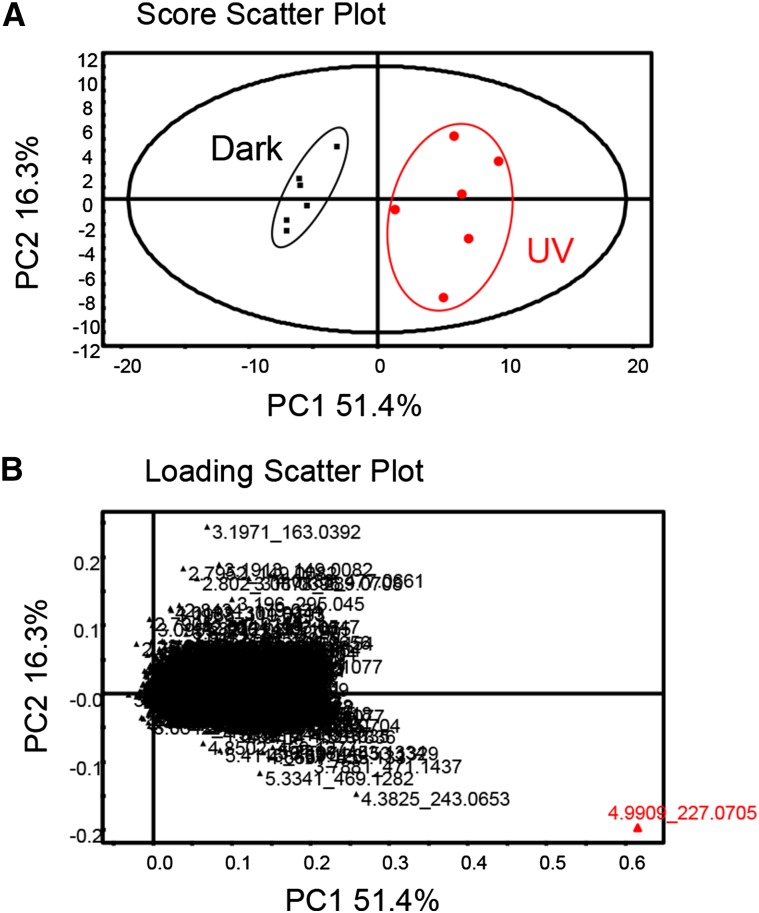
Figure 4.
PCA of the grape berry skin metabolome. A, Score scatterplot of a PCA model on the berry skin metabolome in darkness (squares) and after UV-C light treatment (circles; n = 6 for each treatment). B, Loading scatterplot from the PCA analysis of berry skin in darkness and after UV-C light treatment (n = 2,012 metabolite peaks). Each annotation showed the retention time and mass-to-charge ratio (m/z).

