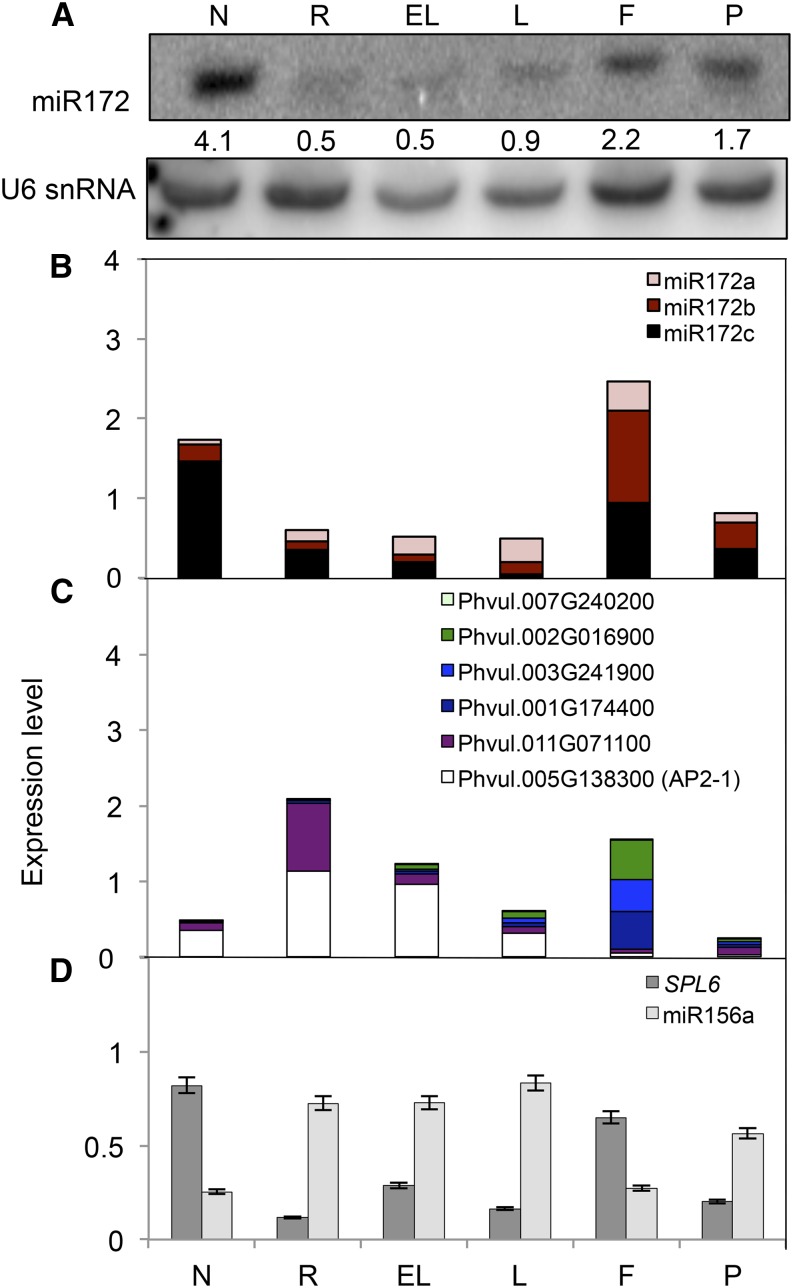
Figure 2.
Expression analysis of miR172, AP2 target genes, miR156a, and its SPL transcription factor target gene in different tissues of R. etli CE3-inoculated common bean plants (18 dpi). A, Mature miR172 levels detected by northern-blot analysis using U6 small nuclear RNA (snRNA) as a loading control for normalization. Signal intensities of the miR172 and U6 hybridization bands for each tissue were determined to calculate normalized expression levels. Numbers in each lane indicate normalized values of miR172 signal intensity. N, Nodules; R, roots; EL, embryonic leaves; L, leaves; F, flowers; P, pods. B to D, Transcript levels of mature miR172 isoforms (B; Supplemental Fig. S1), predicted AP2 target genes (C; Fig. 1), and mature miR156a and its target gene SPL6 (D) determined by qRT-PCR. Expression level refers to gene expression, based on threshold cycle (Ct) value, normalized with the expression of the housekeeping miR159 or UBIQUITIN CONJUGATING ENZYME9 (UBC9) gene.

