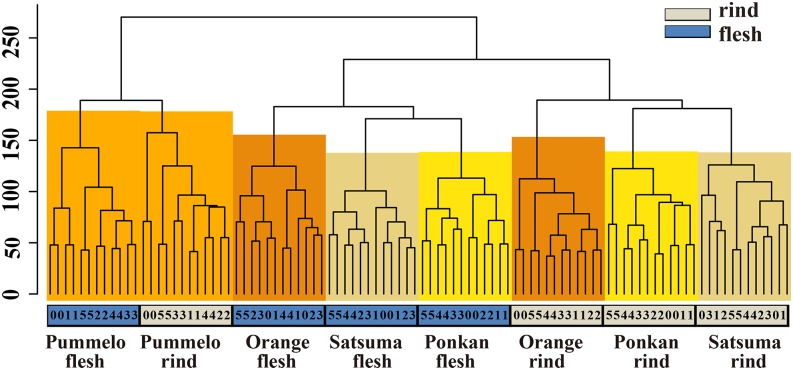
Figure 2.
Hierarchical cluster analysis of all microarray expression data sets. The expression values of all probe sets of the 96 microarrays before DEGs identification were analyzed by hierarchical clustering with Euclidean distance. The cluster dendrogram shows the clear distinctions in expression pattern at the tissue, variety, and time levels. The y axis represents the height value of hierarchical clustering. Numbers 0 to 5 represent 0 to 50 DAH.

