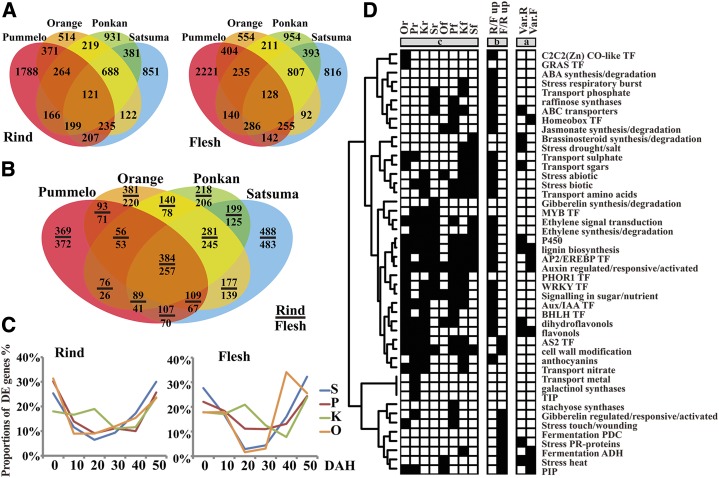
Figure 3.
Identification and function enrichment analysis of DEGs at three levels. A and B, Venn diagrams show DEGs at the variety and tissue levels. C, Proportions of DEGs numbers at the time level. D, Gene function enrichment analysis of DEGs based on Mapman annotation at three levels: variety level (a), tissue level (b), and time level (c). Important Mapman gene function BINs with significant DEGs distribution (hypergeometric P ≤ 0.01) are marked in black.

