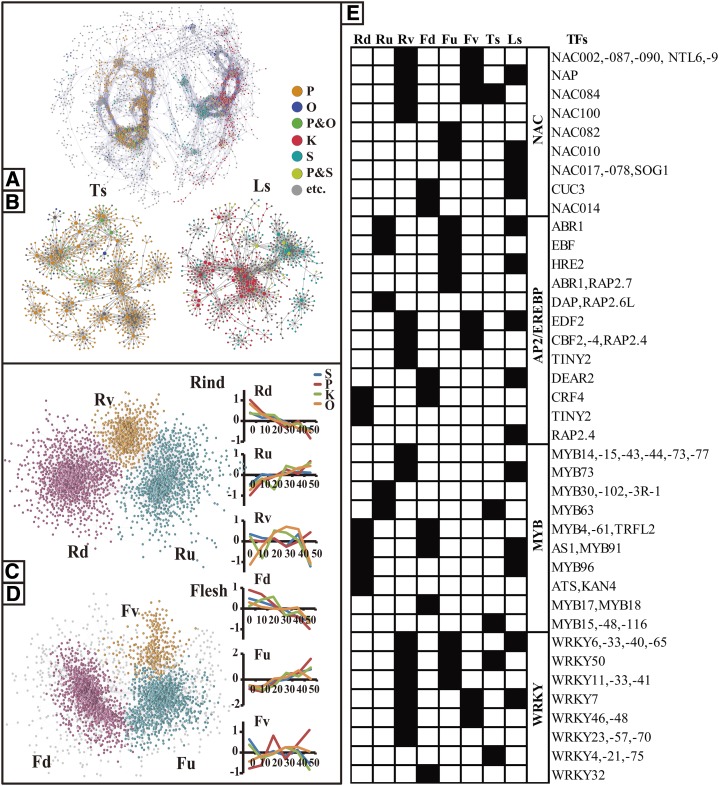
Figure 6.
Overview and TF hubs of Network-DV and coexpression networks of DEGs at the time level (Networks-DT). A and B, Whole Network-DV (A) and its TF-centered subnetworks (B). Network-DV was constructed based on the data set of DEGs at the variety level. The data set was normalized by biweight, resulting in an eight-dimension matrix, and the matrix was calculated by Spearman coefficient (>0.75). Network-DV was unaffectedly divided into two subnetworks: SubTs and SubLs. Bigger nodes represent TF hubs in the subnetworks. Different colors represent the DEGs significant in pummelo (P), orange (O), pummelo and orange (P&O), Ponkan (K), Satsuma (S), Ponkan and Satsuma (P&S), and others (etc.). C and D, Networks-DT of rind and flesh. Networks-DT were constructed based on data sets of DEGs at the variety level in the rind and the flesh. Data sets were normalized by biweight, forming a 48-dimension matrix, and the resulting matrix was calculated by Spearman coefficient (>0.75). Then, the MCL algorithm, a fast and scalable unsupervised cluster algorithm for networks based on the simulation of (stochastic) flow in graphs, was used, which divided each Networks-DT into three major subnetworks (nodes in the same color). Line graphs show the average gene expression values normalized by biweight in each subnetwork. E, Major TF hubs in subnetworks of Networks-DT and Network-DV. TFs from some important TF families that fell into a subnetwork of Networks-DT or Network-DV are marked in black.

