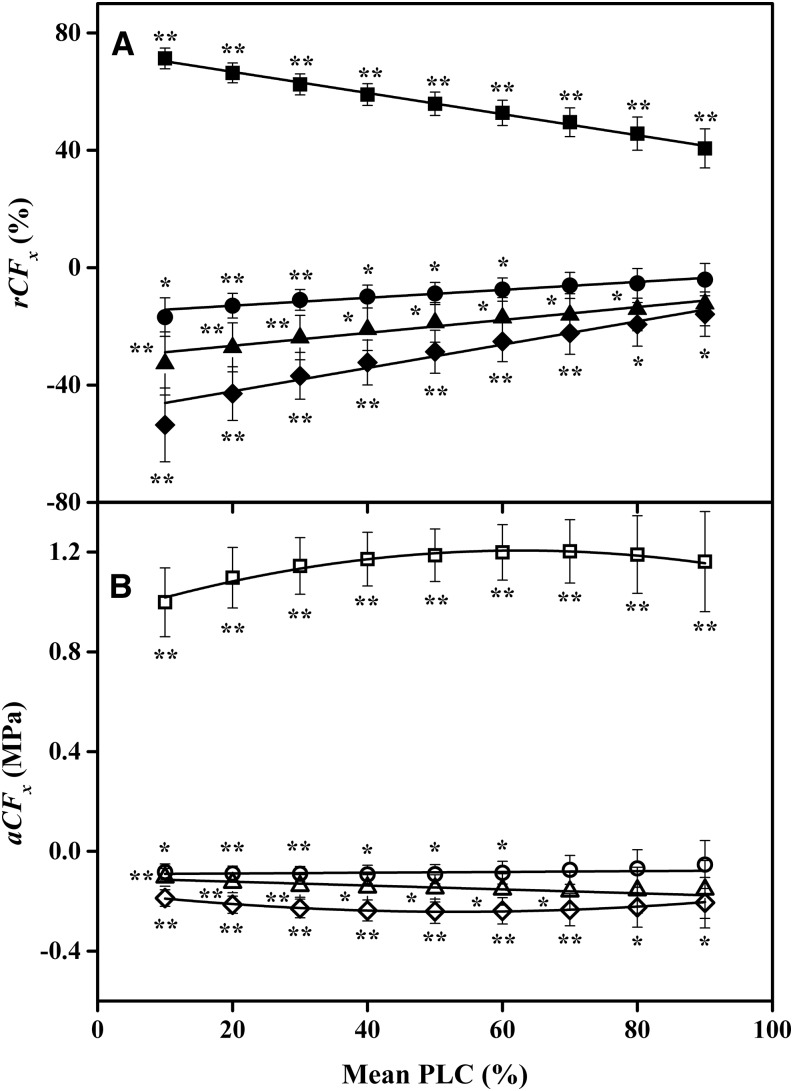
Figure 2.
Two quantitative measures of cavitation fatigue for KCl-flushed samples. The fatigue values were calculated from the mean of the differences in Equation 3B, which is considered a more powerful test of differences between VCs. A, Mean rCFx versus x = the PLC at which rCFx was evaluated. Squares compare first and second VCs, y = −0.3612x + 74.012 (r2 = 0.9952, P = 2E-09); triangles compare second and third VCs, y = 0.2335x − 31.992 (r2 = 0.9444, P = 1E-05); circles compare third and fourth VCs, y = 0.1436x − 16.341 (r2 = 0.95, P = 8E-06); and diamonds compare second and fourth VCs, y = 0.43x − 52.274 (r2 = 0.9489, P = 9E-06). B, Mean change in aCFx versus x = the PLC at which aCFx was evaluated. Squares compare first and second VCs, y = −7E-05x2 + 0.0086x + 0.9352 (r2 = 0.9758, P = 1E-5), although the individual points were not significantly different from each other (P = 0.334); triangles compare second and third VCs, y = −0.0006x − 0.1146 (r2 = 0.7535, P = 0.0024); circles compare third and fourth VCs, y = 0.0004x − 0.099 (r2 = 0.5669, P = 0.019); and diamonds compare second and fourth VCs, y = 3E-05x2 − 0.0029x − 0.1636 (r2 = 0.9877, P = 2E-6). Error bars indicate se. Symbols without asterisks were not significantly different from 0. The P values in the linear regressions give the probability that the slope is 0.

