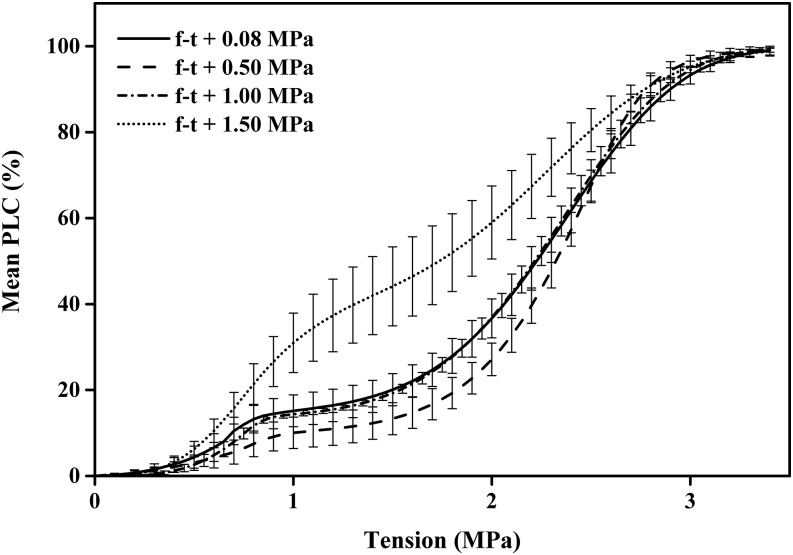
Figure 4.
Vulnerability curves measured in stems following a freeze-thaw cycle (f-t) at varying tensions. Frost-induced embolism was removed by flushing before measuring the VCs; hence, the double s curves were caused by frost fatigue. Means of six to eight VCs were measured on flushed stems by the cavitron technique where each curve was fitted with a dual Weibull, then the mean and se of all six to eight best fit curves were computed.

