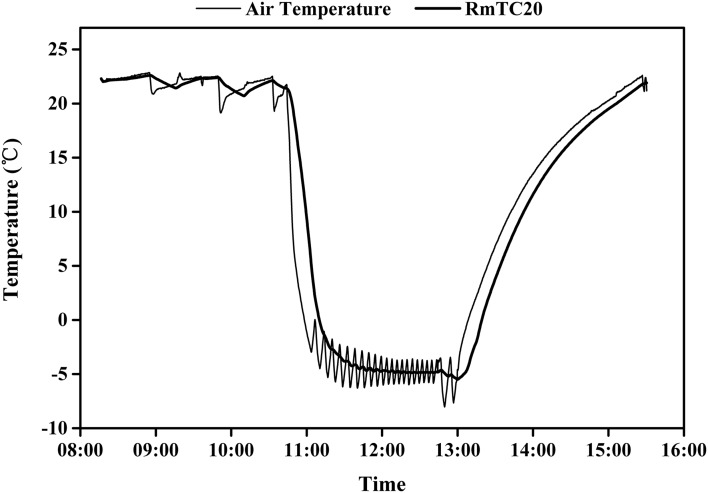
Figure 9.
Plot of temperature versus time for a typical freeze-thaw cycle. Air temperature (thin line) in the cavitron was collected every 10s. However, 20-min running mean air temperature (RmTC20; thick line) reflected more precisely the correct stem temperature (Fig. 8). The stems thawed more slowly than they froze because the centrifuge did not have active heating; hence, the stems and centrifuge were passively heated by the warm laboratory.

