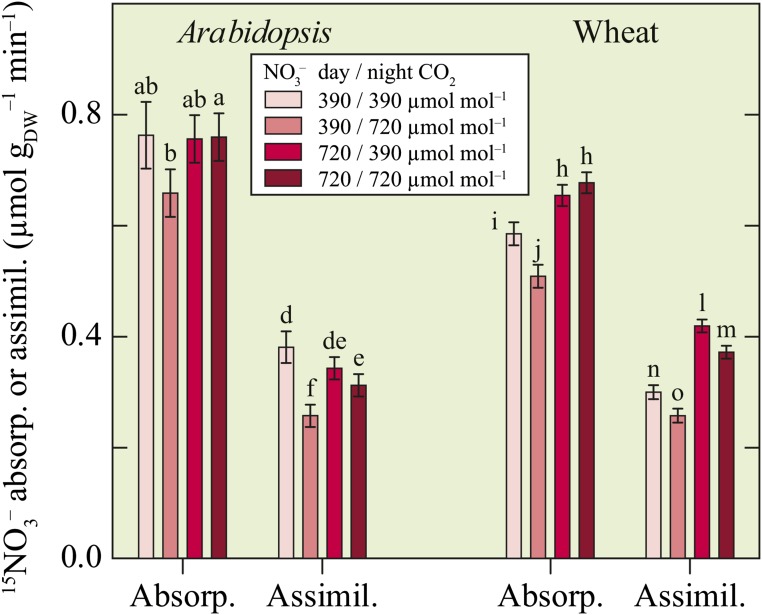
Figure 3.
Whole-plant 15NO3− absorption and assimilation (µmol NO3− gDW–1 [for grams per dry weight] min–1) in the dark for Arabidopsis and wheat exposed to one of four CO2 treatments: ambient during the day and night (390/390 µmol mol–1), ambient during the day and elevated at night (390/720 µmol mol–1), elevated during the day and ambient at night (720/390 µmol mol–1), or elevated during the day and night (720/720 µmol mol–1). Shown are the means ± se (n = 5–14). Bars for one species labeled with different letters differed by P < 0.10.

