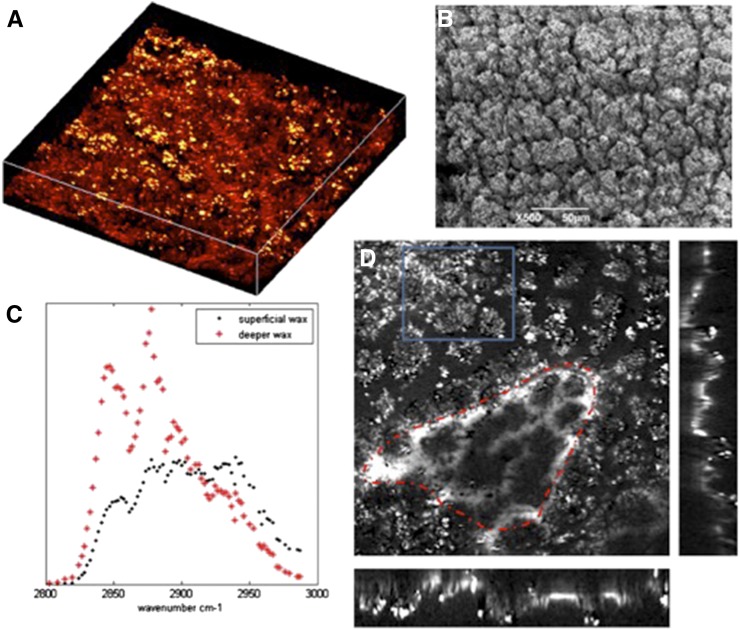
Figure 6.
SRS spectral images of D. anthonyi cuticle. SRS spectral imaging of D. anthonyi cuticle waxes shows changes in chemical composition with depth. A and B, The SRS and SEM images, respectively, of D. anthonyi leaf showing the crystalline structure of cuticle wax deposits on the adaxial surface. The image in A is a three-dimensional reconstruction of an image stack taken from a 126- × 126-µm field of view at the 2,840 cm–1 Raman shift. C, SRS spectral scans taken from the more superficial and deeper wax areas indicated on D. Blue rectangle, An area of superficial wax; red line, an area deeper in the cuticle. The imagess on the right and bottom of the main image in D are from the orthogonal views through the stack showing the depth profile image of the cuticle wax.

