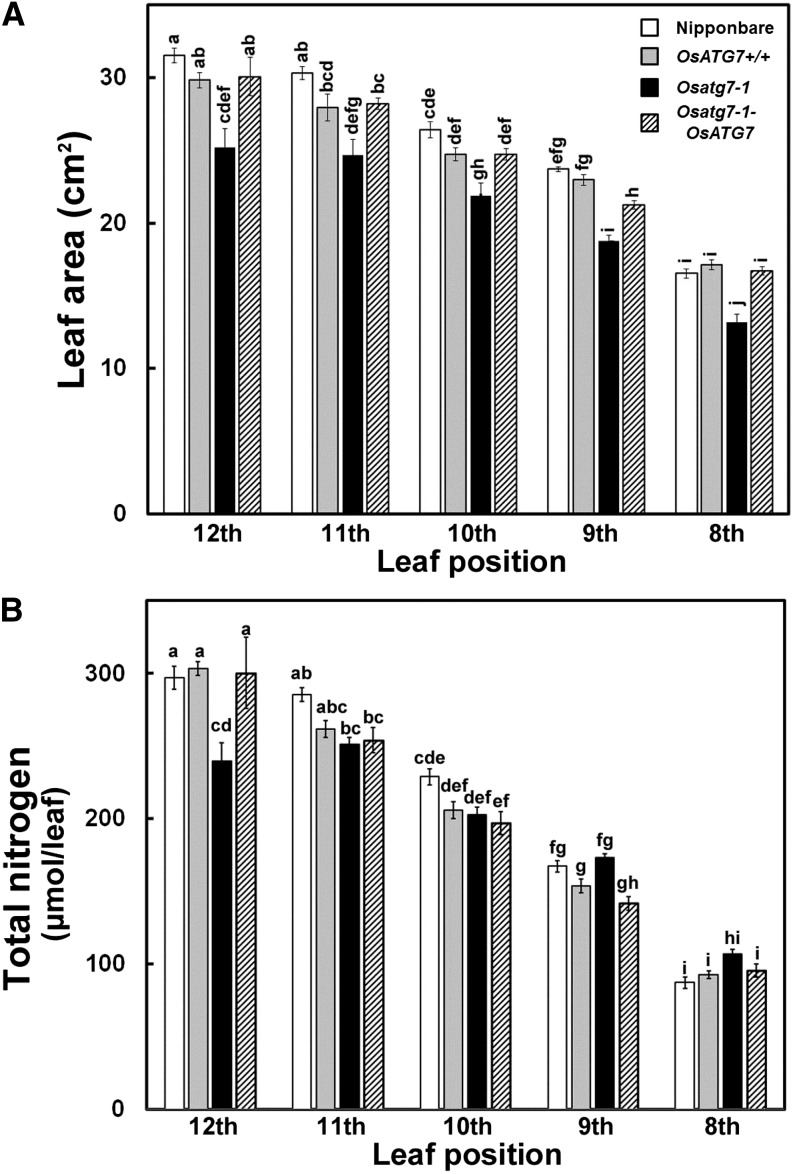
Figure 11.
Comparison of leaf area and total nitrogen in leaves of Osatg7-1 and control plants. Leaf area (A) and total nitrogen content per leaf (B) from 12th to eighth leaves on the main stem of cv Nipponbare, OsATG7+/+, Osatg7-1, and Osatg7-1-ATG7 are shown. Data are means ± se (n = 4). Different letters denote significant difference based on Tukey’s honestly significant difference test (α = 0.05).

