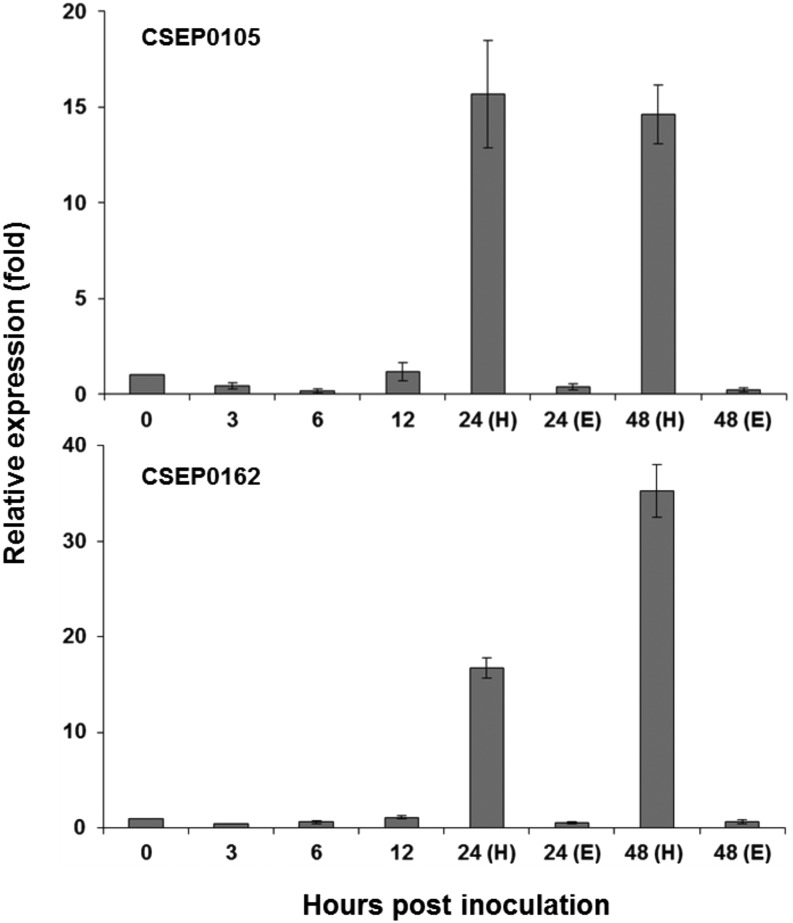
Figure 2.
Expression patterns of CSEP0105 and CSEP0162 at different stages of Bgh development. Total RNA was isolated from Bgh-infected (isolate DH14) barley leaves (cv Golden Promise) at 0, 3, 6, 12, 24, and 48 hpi. H and E denote haustorial and epiphytic expression. Expression of Bgh glyceraldehyde 3-phosphate dehydrogenase was used to normalize the CSEP expression in each sample. Relative expression was determined compared with time point 0 hpi, arbitrarily set to 1. Three biological and two technical repetitions were included for each time point. Data shown are means ± se of three independent biological repetitions.

