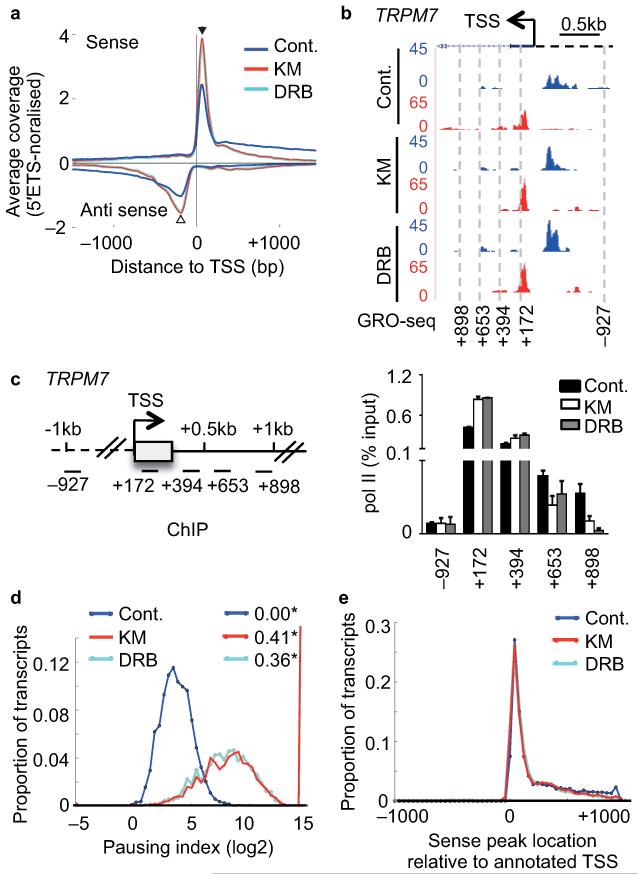
Figure 2. CDK9 inhibitors globally affect early elongation.
(a) Metagene profile of average global run-on sequencing (GRO-seq) coverage (normalised to 45S-5′ETS) of non-overlapping protein-coding genes (>5kb) centred at the TSS with and without KM or DRB treatment of cells. Antisense reads are depicted as negative values. (b) GRO-seq profile of TRPM7 with treatment indicated on the UCSC genome browser. Forward strand reads are noted in blue and reverse strand reads in red here and in subsequent figures. The direction of sense transcription is marked by an arrow. (c) Left, gene schematic of TRPM7. Right, qRT-PCR analysis of pol II ChIP performed on HeLa cells untreated (Cont.) or treated with 100 μM KM or DRB. Error bars, s.e.m. (n = 3 biological replicates). (d) Distribution of log2 of pausing index for individual genes after treatment. Pausing index is calculated as ratio of read density in the TSS-proximal peak to that in the first 5kb of the gene body. * values indicate the proportion of genes with no reads in the 5kb body. (e) Distribution of positions of peaks of sense signal (in 100bp windows) relative to the annotated TSS for each gene after treatment.

