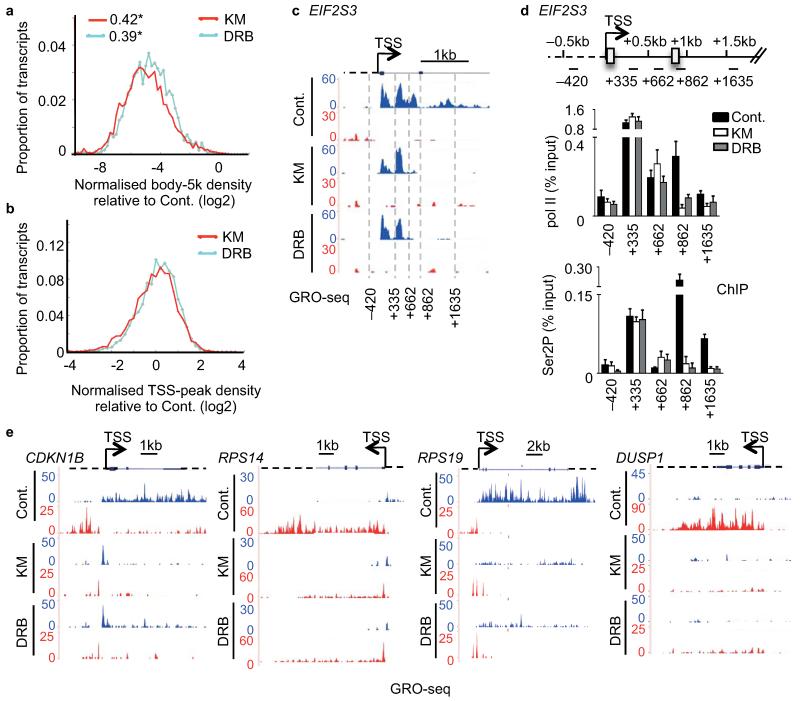
Figure 3. The promoter-proximal response to P-TEFb inhibitors varies.
(a,b) Distribution of log2 of the ratio between treated and control samples for normalised read density in the first 5kb of the gene body (a) and in the TSS-proximal peak (b). * values in (a) indicate the proportion of genes with no reads in the 5kb body. (c) GRO-seq profile of EIF2S3. (d) Top, gene schematic of EIF2S3. Bottom, qRT-PCR analysis of pol II and Ser2P ChIP performed on HeLa cells untreated (Cont.) or treated with 100 μM KM or DRB. Error bars, s.e.m. (n = 3 biological replicates). (e) GRO-seq profile of CDKN1B, RPS14, RPS19 and DUSP1.

