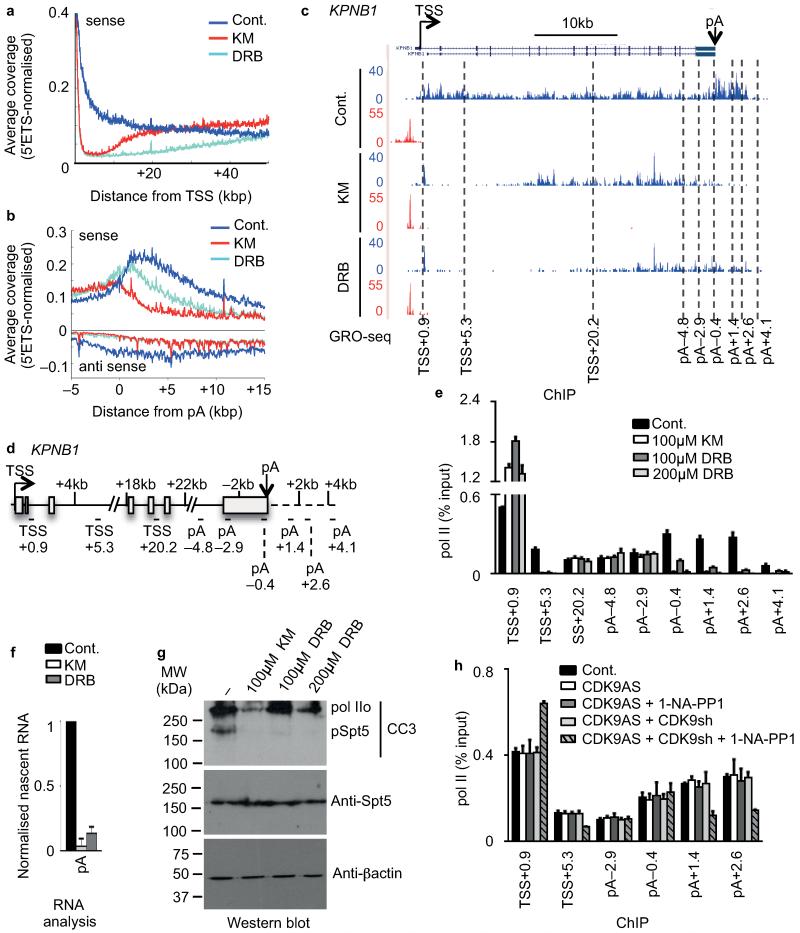
Figure 4. Uncovering a poly(A)-associated elongation checkpoint.
(a,b) Metagene profile of average GRO-seq coverage (normalised to 45S-5′ETS) of long protein-coding transcripts (>50kb) after treatment centred at TSS (0) (a) and on the terminal poly(A) cleavage site (pA) (b). (c) GRO-seq profile of KPNB1 with treatment indicated. The middle of amplicons used for subsequent analysis is indicated in kilo base pair (kb) related to the TSS or to the pA site. (d) Gene schematic of KPNB1. (e) qRT-PCR analysis of pol II ChIP performed on HeLa cells untreated (Cont.) or treated with 100 μM KM, 100 μM DRB or 200 μM DRB. Error bars, s.e.m. (n = 3 biological replicates). (f) qRT-PCR analysis of nascent RNA in HeLa cells untreated (Cont.) or treated with 100 μM KM or DRB. Error bars, s.e.m. (n = 3 biological replicates). (g) Western blot analysis of cell extract after treatment of cells with KM or DRB, using the indicated antibodies. The CC3 antibody has been shown to recognize hyperphosphorylated (IIo) pol II and phosphorylated Spt544. β-actin serves as a loading control. (h) qRT-PCR analysis of pol II ChIP in control (Cont.) or myc-tagged analog-sensitive CDK9 (CDK9AS)-expressing HEK 293 cell. Cells were also transfected with endogenous CDK9 mRNA-specific shRNA (shRNA) and treated with 1-NA-PP1 as indicated. Error bars, s.e.m. (n = 3 biological replicates).

