
Figure 1.
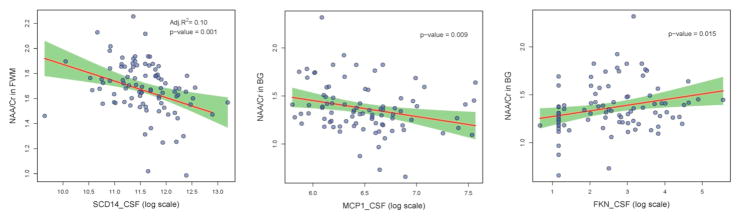
In all figures, the red line shows the linear regression fit of the association between the soluble biomarker levels in CSF and cerebral metabolite values, the green shaded area indicates the 95% pointwise confidence interval, and the blue dots are the raw data. Figures 1A (left): Higher sCD14 levels in CSF correlate with lower NAA/Cr ratios is FWM. Figure 1B (center): Higher MCP-1 levels in CSF correlate with lower NAA/Cr ratios is BG. Figure 1C (right): Lower FKN levels in CSF correlate with lower NAA/Cr ratios in BG.