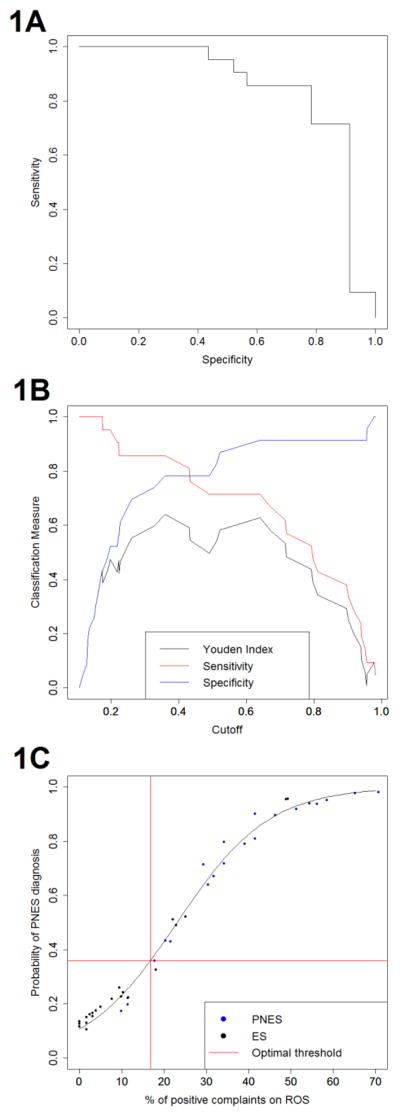
Figure 1.

Plots showing the utility of ROS for diagnosing PNES and ES: 1a. Receiver operating characteristic (ROC) curve for classification performance based on percentage of complaints on ROC. 1b. Sensitivity, specificity and Youden Index at various cutoff thresholds. 1c. Optimal threshold for PNES diagnosis based on percentage of positive complaints on ROS.
