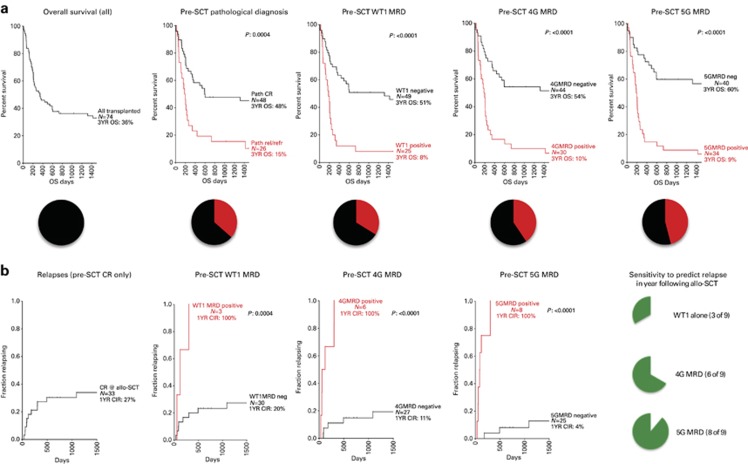
Figure 4.
MG-MRD allows stratification into highly polarized groups for survival and relapse risk. (a) Three-year OS. MG-MRD can effectively segregate patients based on pre-SCT peripheral blood gene expression profile into groups with high and low risk of survival following transplantation. Color pie chart below survival curve illustrates the fraction of the entire cohort triaged to the high-risk category (red) based on the MRD method used. (b) Relapses in the first year after transplantation. Including only patients in pathologist-confirmed CR prior to transplantation and excluding patients dying of non-relapse causes. The green pie chart illustrates sensitivity of each pre-SCT MRD test to predict relapse in the year following transplantation. Statistical analysis was performed using GraphPad Prism with comparison between survival and relapse curves performed using the log-rank (Mantel–Cox) test.

