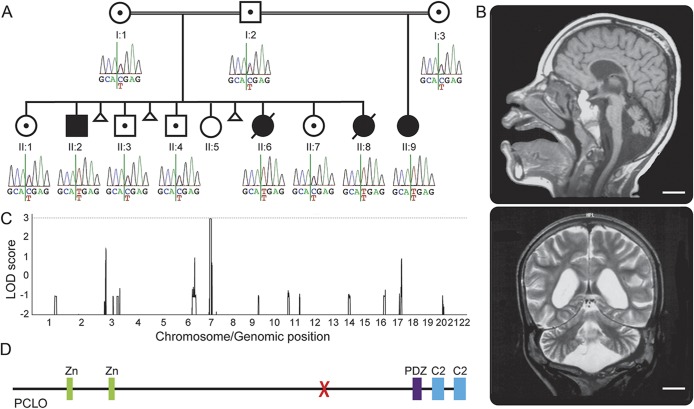
Figure 1. The pedigree studied and identification of a homozygous PCLO mutation.
(A) The pedigree studied with genotype of the identified PCLO mutation in each individual. Only the affected individuals show the homozygous C to T change. (B) Brain MRIs of individual II:2 at age 11 years, 10 months. Sagittal T1-weighted image shows a thin pons and small cerebellar vermis. The corpus callosum is thin. Coronal T2-weighted image shows generalized reduction of the cerebral white matter and atrophic cerebellar hemispheres. Scale bars = 2 cm. (C) Genome-wide linkage analysis. A region on chromosome 7 shows a maximum multipoint LOD score of 2.958. (D) Schematic representation of the PCLO protein. X = the location of the identified mutation. C2 = C2 domain; LOD = logarithm of odds; PDZ = PDZ domain; Zn = zinc finger domain.

