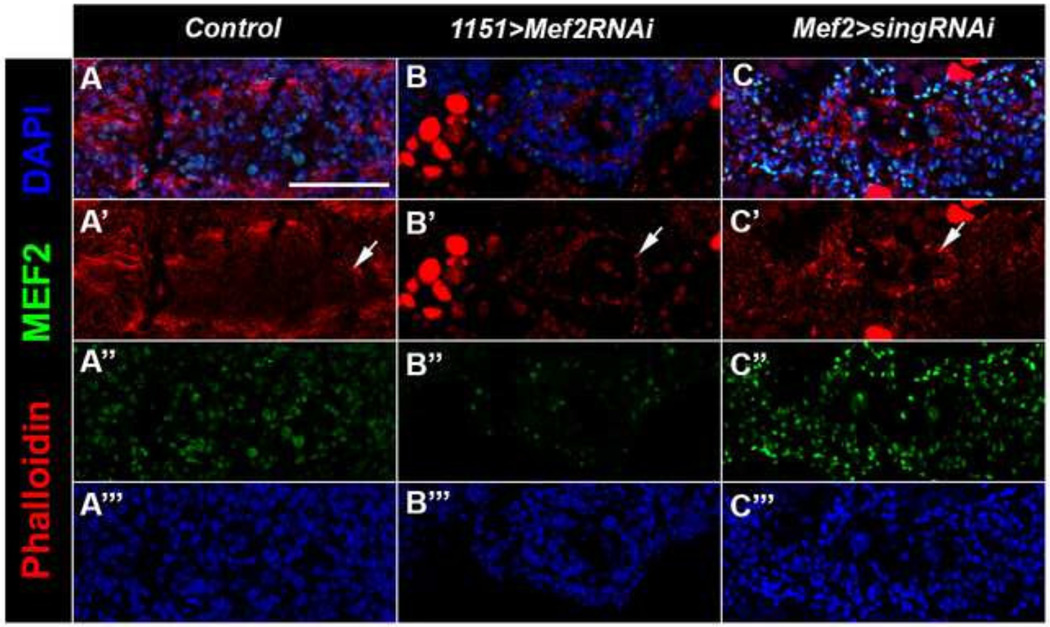
Figure 5. F-actin foci are detected in sing and Mef2 knockdowns.
(A–C) Horizontal sections of samples aged to 24h APF stained with Phalloidin (red) to visualize F-actin, anti-MEF2 (green), and DAPI (blue) to visualize nuclei. Arrows mark F-actin foci. (A) Wild type control shows normal fusion of myoblasts to the larval templates. (B) Mef2 RNAi show smaller templates with fewer nuclei and pronounced actin foci. (C) sing RNAi shows actin foci at the periphery of the template. Scale bar, 50 µm.

