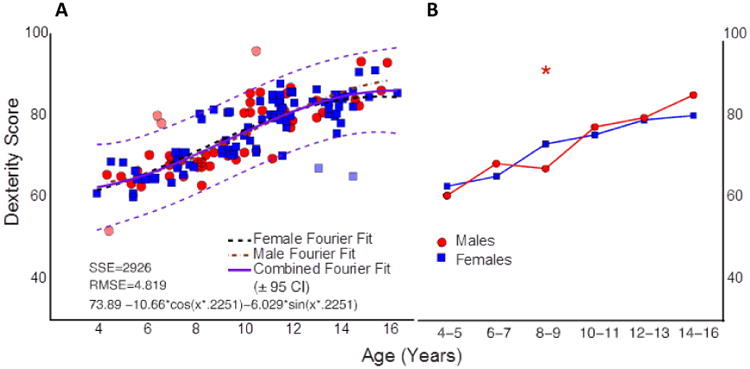
Fig. 6.

Dexterity score from children 4-16 years of age on the SD test shown to depict the significant change in performance across age. A. The regression line (CI – 95%) on a Fourier robust fit is shown in green/magenta, respectively. Data in A and B are colored by gender (blue, girls; red, boys), with individual regression lines for each. Significant increase in dexterity score by adjacent age groups were found across childhood and into late adolescence as indicated by asterisks (P = < 0.05), SSE=sum of squared residuals; RMSE=root mean squared error; CI=confidence interval. Permission to reprint from Dayanidhi et al.37 was received.
