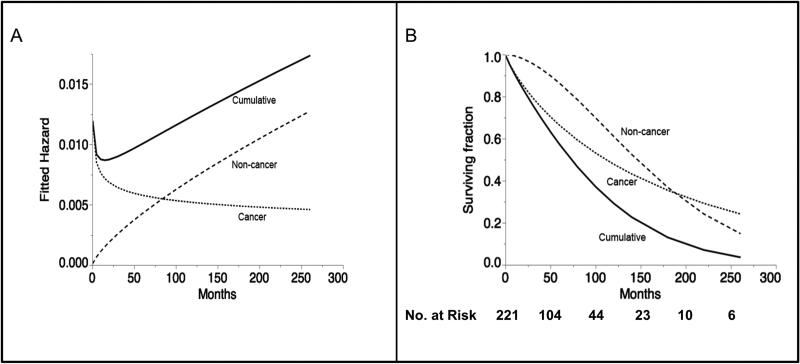
Figure 2.
Weibull plot of competing risk of death over time. Figure 2a depicts the hazard ratio of death from cancer-specific, non-cancer specific and cumulative death hazard over the course of follow-up. Figure 2b depicts the Weibull fit of the competing causes cumulative survival, and iteratively omitting competing risk based on coded cause of death.

