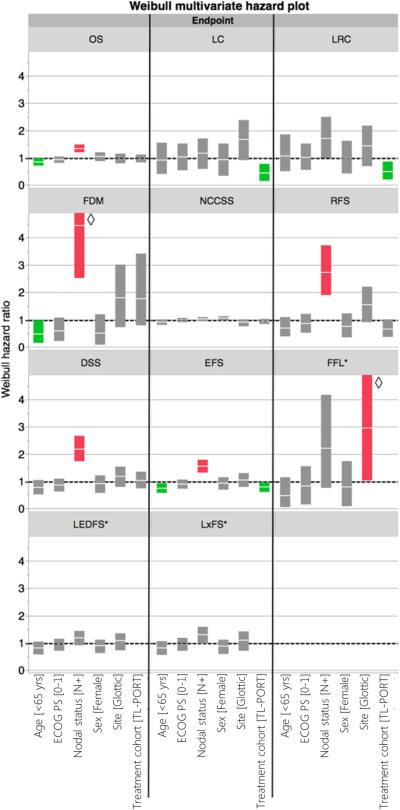
Figure 5.
Results of Weibull multivariate hazard model, showing hazard ratio as solid white stripe, with solid block representing 95%CI of hazard ratio. Statistical significance is indicated if the 95%CI hazard ratio boxplot does not encroach upon a risk ratio of 1.0; red boxplots represent increased probability of endpoint occurrence, while green boxplots indicate risk reduction. OS, LC, LRC, FDD, RFS, EFS, DSS, and NCCSS proportional hazards were assessed for all patients (n=221). LEDFS, LxFS, and FFL hazard ratios (labeled with a “*”) were calculated only for those patients dispositioned to larynx preservation initially (n=60). ◇ Upper limits of these boxplots are truncated for aesthetic considerations.

