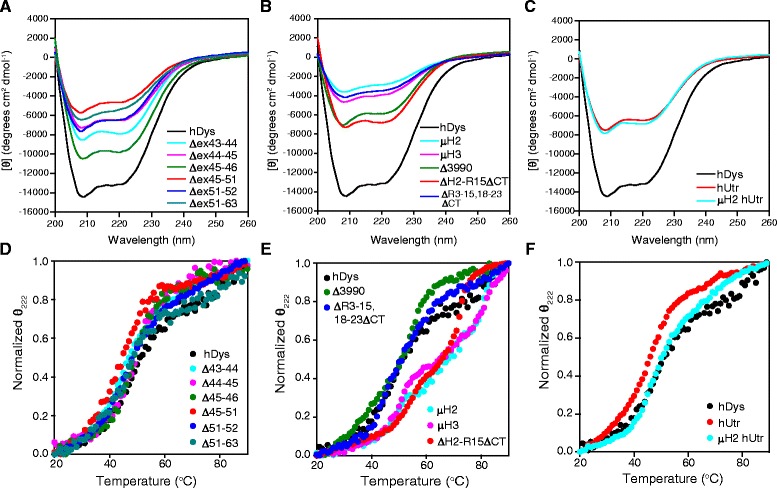
Figure 4.

Spectra and melt curves obtained by circular dichroism spectroscopy. (A-C) Circular dichroism absorption spectra from 200 to 260 nm for exon-skipped dystrophins (A), gene therapy constructs (B), and utrophins (C). Molar ellipticity [θ], with units of degrees centimeter squared per decimole, was calculated as θ / (10 × c × l) where c is the molar concentration of the sample (mole/L) and l is the path length in cm. (D-F) CD absorption spectra monitored at 222 nm from 20°C to 90°C for exon-skipped dystrophins (D), gene therapy dystrophins (E), and utrophins (F). Melt curves were normalized to θ222 from 0 to 1 fraction unfolded and a representative curve plotted. See Table 1 for melting temperatures (CD Tm1 and Tm2). hDys - human dystrophin, hUtr - human utrophin.
