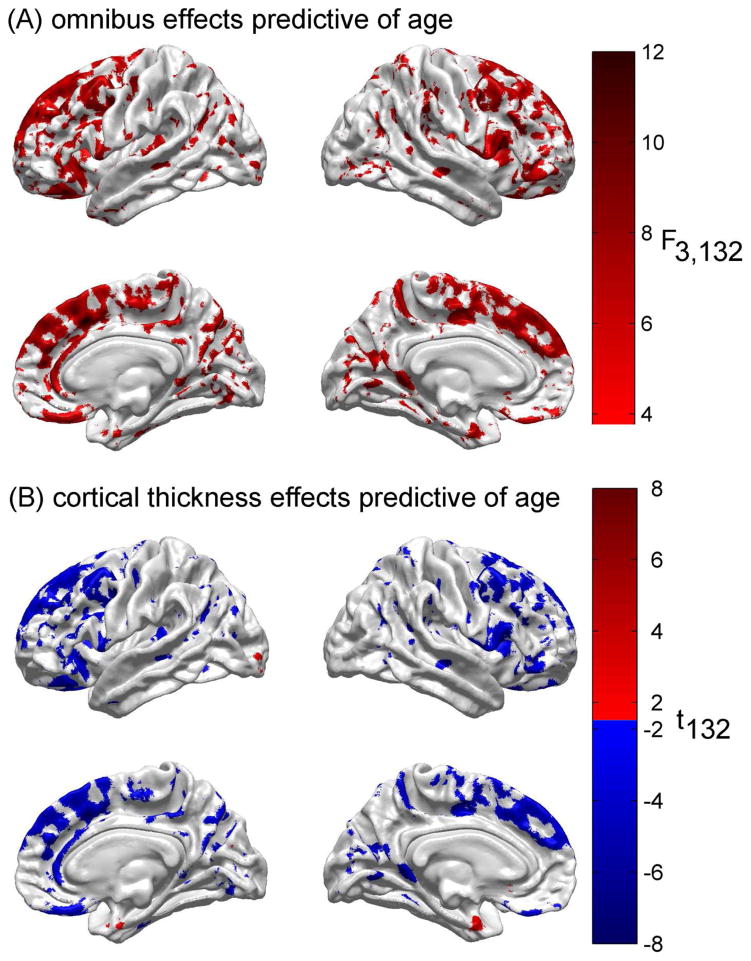
Fig. 1.
(A) Results of the statistical analysis to determine the extent to which all three feature variables (cortical thickness, CD and mean FA) can predict chronological age. For each cortical location, the F statistic with 3 and 132 d.f. is displayed for the omnibus test of the null hypothesis that none of the three independent variables predicts subject age. Here and throughout, the displayed values of the test statistic are thresholded for significance using FDR < 0.05. (B) Result of testing the null hypothesis that cortical thickness does not contribute to the regression model above and beyond all other predictor variables. The test statistic is Student’s t with 132 d.f. Some areas are colored in red, corresponding to t > 0, whereas others are colored in blue, indicating that t < 0. For areas colored in red, as cortical thickness increases, so does age. For areas colored in blue, as thickness decreases, age increases.

