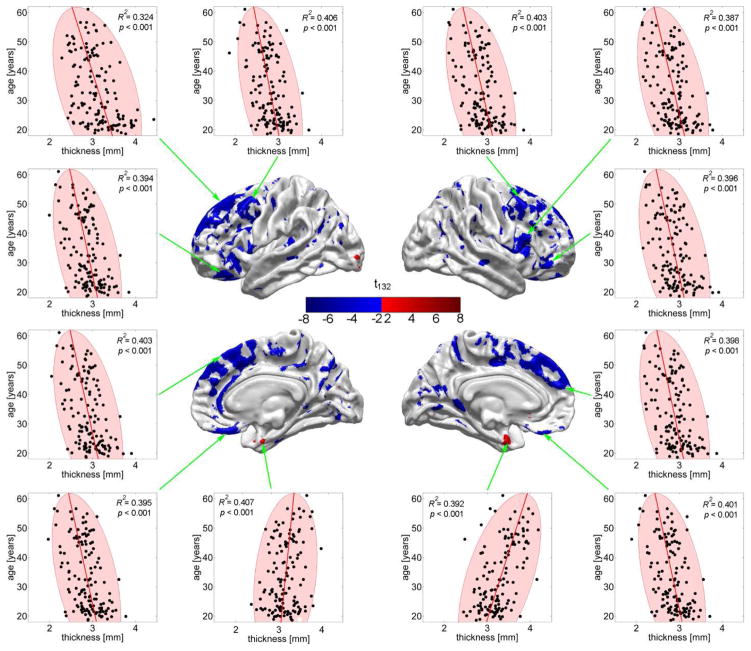
Fig. 2.
CA (in years) as a function of cortical thickness (in mm) at 12 locations where thickness contributes to the regression above and beyond all other predictor variables (see text). Each dot represents a subject and ellipses are drawn to indicate the 95% confidence regions for thickness. The linear relationship between CA and cortical thickness within the CA range displayed (18.6 to 61.1 years) is apparent. Outliers (dots located outside the confidence interval) indicate the presence of subjects with atypical cortical thickness values given their CAs. Note the decrease in thickness at all highlighted locations, with the exception of two locations (bottom row, middle) where cortical thickening as a function of age is apparent.

