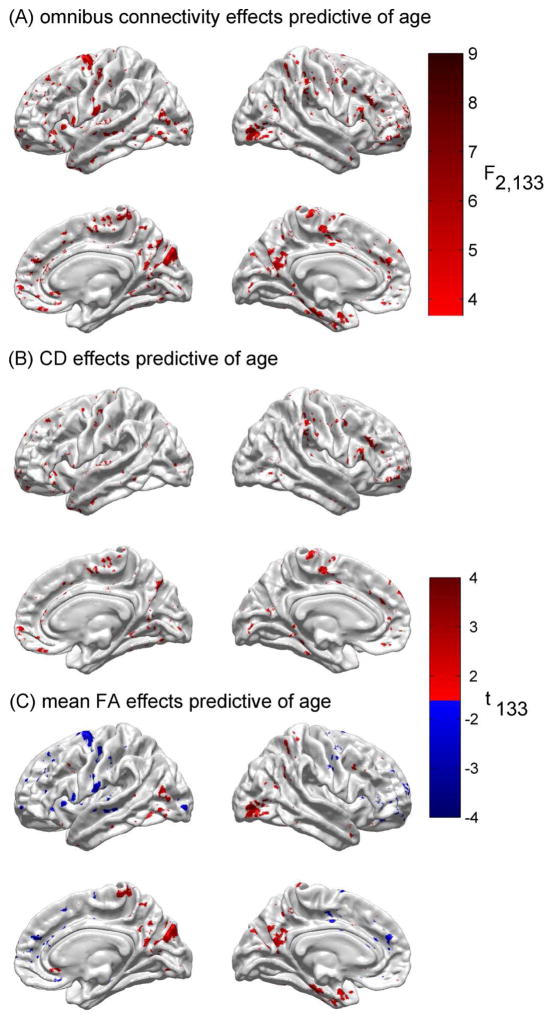
Fig. 3.
(A) Results of testing the null hypothesis that neither of the connectomic variables predicts age above and beyond the ability of cortical thickness to do so. As in Figure 1A, the test statistic is the F statistic with 2 and 133 d.f. Color-coded arrows indicate prominent regions where the null hypothesis is rejected, namely the paracentral lobule of the right hemisphere (magenta), the anterior bank of the central sulcus in the left hemisphere (green), the banks of the parieto-occipital sulci (bilaterally, black), and the antero-medial aspects of the superior frontal gyri (bilaterally, cyan). (B) Results of testing the null hypothesis that CD alone cannot predict age above and beyond the ability of cortical thickness to predict it. As in Figure 1B, the test statistic is Student’s t with 133 d.f. (C) As in (B), for mean FA.

