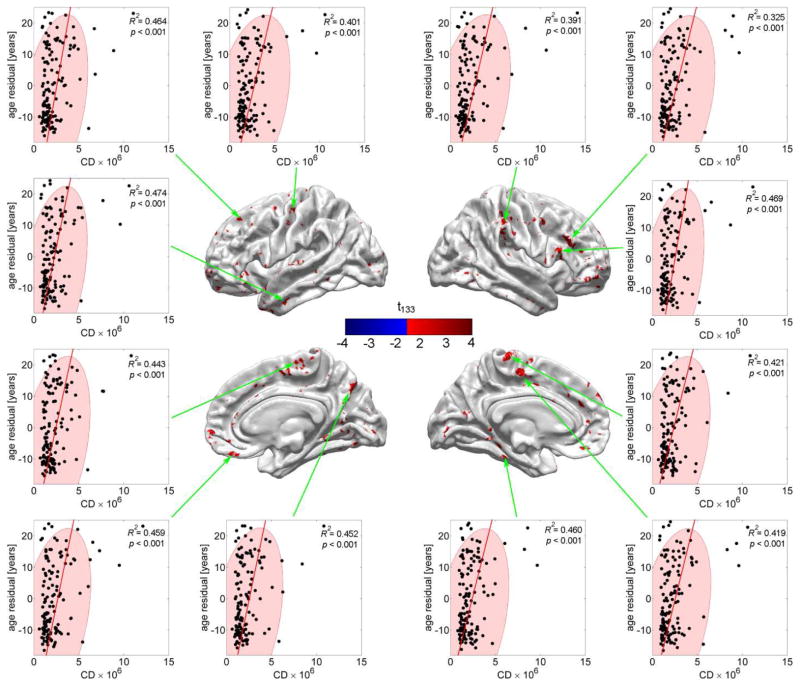
Fig. 4.
Residual CA (in years) as a function of CD (scaled by 106 for convenience) at 12 locations where CD contributes to the regression above and beyond cortical thickness (see text). Each dot represents a subject; ellipses are drawn to indicate the 95% confidence regions for CD. Note that (1) the residual CA can be either positive or negative, depending on whether thickness alone over- or underestimates CA, and that (2) there are outliers much farther outside the confidence region than in the case of cortical thickness (Figure 2) or mean FA (Figure 5).

