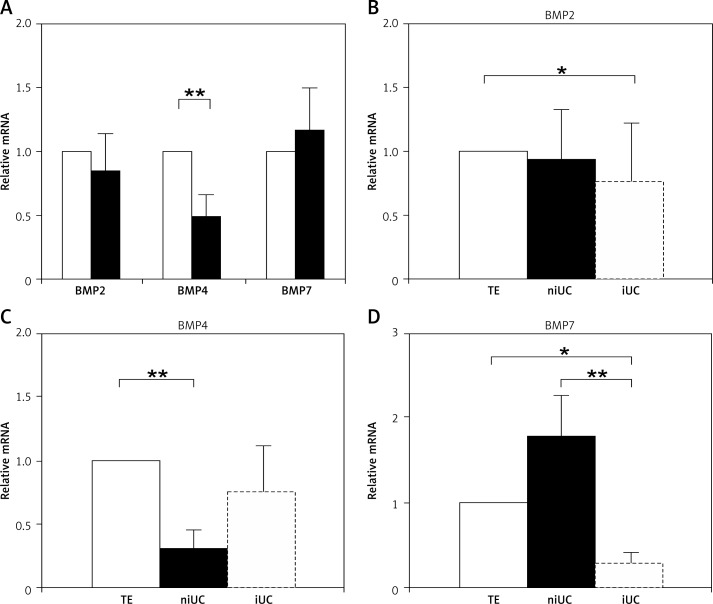
Figure 1.
The BMP2, BMP4 and BMP7 expression level relative to healthy transitional epithelium (TE). Comparison between healthy urothelial transitional tissue (n = 33, empty bars) and urothelial carcinoma samples (n = 42, black bars) (A), BMP2 (B), BMP4 (C) and BMP7 (D) relative expression level in healthy TE (n = 33, TE), non-invasive urothelial carcinoma (n = 24, niUC) and invasive urothelial carcinoma (n = 18, iUC)
Significance of the difference is indicated as follows *p < 0.05; **p < 0.01; Error bars represent SEM.

