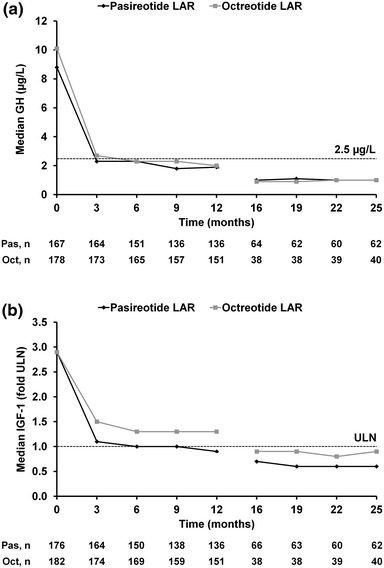
Fig. 3.

Median a GH and b IGF-1 levels during treatment. The total numbers of patients with evaluable measurements for GH and IGF-1 are shown beneath each graph. Oct octreotide LAR; Pas pasireotide LAR

Median a GH and b IGF-1 levels during treatment. The total numbers of patients with evaluable measurements for GH and IGF-1 are shown beneath each graph. Oct octreotide LAR; Pas pasireotide LAR