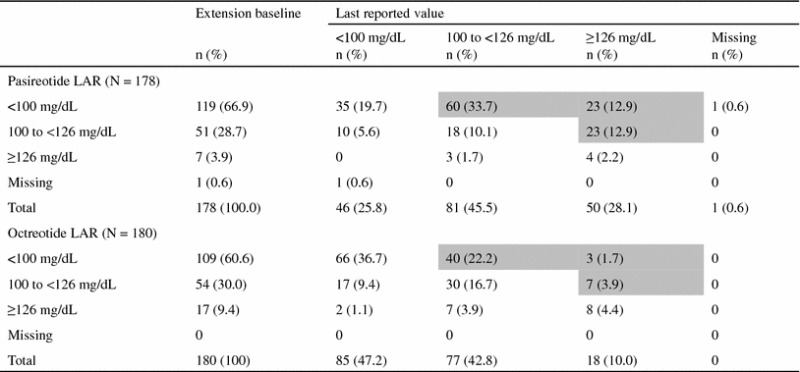
Table 4.
Overall shift in glucose from core baseline to last available value up to month 26

Shaded boxes represent the patients with a shift in glucose level (mg/dL) that indicates a worse diabetic status at the last reported value compared with core baseline
