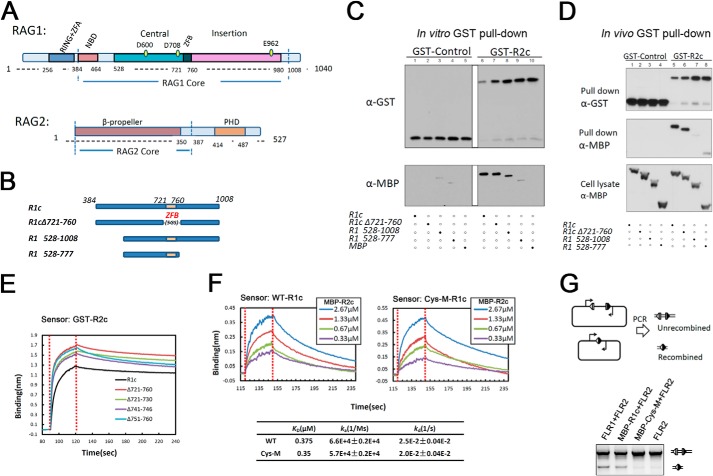
FIGURE 1.
Zinc finger B is not required for the RAG1-RAG2 interaction. A, schematic diagram of RAG1 and RAG2 proteins. RING+ZFA, RING finger plus zinc finger A; NBD, nonamer binding domain; ZFB, zinc finger B; PHD, plant homeodomain. Numbers refer to aa in the mouse RAG proteins. B, diagram of MBP-tagged R1c proteins used in in vivo and in vitro GST pulldown experiments. 5GS, five repeats of Gly-Ser. C, in vitro GST pulldown experiment. GST or GST-R2c was used to pull down MBP-tagged R1c proteins as indicated below the lanes, with the results revealed by Western blotting with the indicated antibodies. Data are representative of two experiments. D, in vivo GST pulldown experiment. GST or GST-R2c was used to pull down MBP-tagged R1c proteins as indicated below the lanes from whole cell extracts of transfected HEK293T cells, with the results revealed by Western blotting with the indicated antibodies. Data are representative of four experiments. E, biolayer interferometry (BLItz) sensorgrams obtained using GST-R2c-loaded biosensors and a 20 μm solution of WT or ZFB-deleted R1c proteins, with red dotted lines indicating the start of the binding (left) and dissociation (right) phases. F, sensorgrams obtained using biosensors loaded with MBP-tagged WT and ZFB-double cysteine mutant (Cys-M) R1c proteins, incubated with different concentrations of MBP-R2c, as indicated, were used as analysts and generated a series of sensorgrams. Binding curves were fit globally to a 1:1 binding model to yield equilibrium dissociation constant (KD), and association (ka) and dissociation (kd) rate constants. G, in vivo V(D)J recombination assay of R1c and Cys-M. Diagram of the starting and recombined substrates is shown with RSSs (triangles), coding flanks (rectangles), and PCR primers (arrows) indicated. The upper (755 bp) and lower (350 bp) bands in the agarose gel analysis are the products from the unrecombined and recombined substrates, respectively. FLR1 and FLR2, full-length RAG1 and RAG2, respectively. Data are representative of four experiments.

