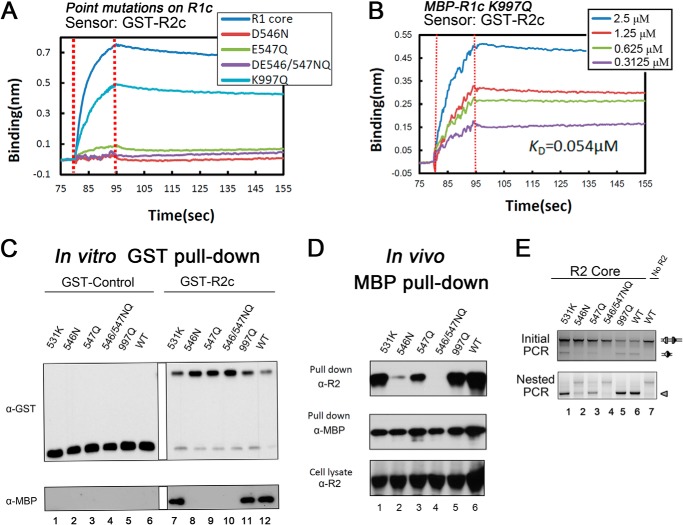
FIGURE 6.
Functional analysis of RAG1 core mutants. A, sensorgrams obtained using GST-R2c-loaded biosensors, incubated with 20 μm WT or mutant MBP-R1c proteins, as indicated. B, sensorgrams obtained using GST-R2c-loaded biosensors, incubated with the indicated concentrations of MBP-R1c K997Q, with the calculated KD shown. C, in vitro GST pulldown experiments were performed as described in Fig. 1C with WT or mutant MBP-R1c proteins, as indicated. Data representative of two experiments. D, in vivo MBP-pulldown experiments were performed as described in Fig. 1D with WT or mutant MBP-R1c proteins, as indicated. Data are representative of two experiments. E, V(D)J recombination assay using WT and mutant RAG1 core proteins, as indicated, as described in Fig. 1G, with confirmation by nested PCR to increase the sensitivity (arrowhead indicates expected recombined product). Data are representative of three experiments.

