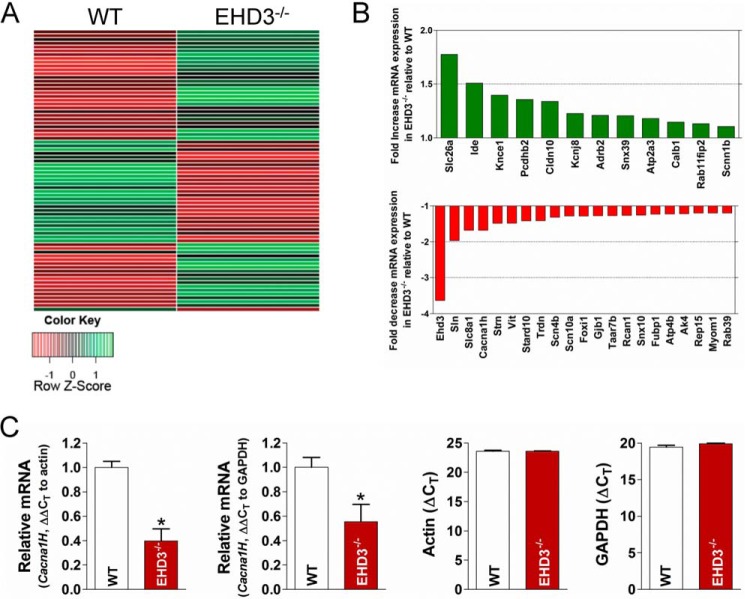
FIGURE 1.
Cacna1h transcript levels are reduced in EHD3−/− heart. A, representative heat map of microarray data generated by analyzing relative transcript levels (∼25,000 mRNA targets) in WT versus EHD3−/− hearts (n = 3 each). B, select genes of interest with known roles in endosomal transport or excitation contraction coupling that were significantly different in expression between WT and EHD3−/− hearts. C, quantitative PCR results of Cacna1h levels between WT and EHD3−/− hearts. Both actin and GAPDH are included as controls (right).

