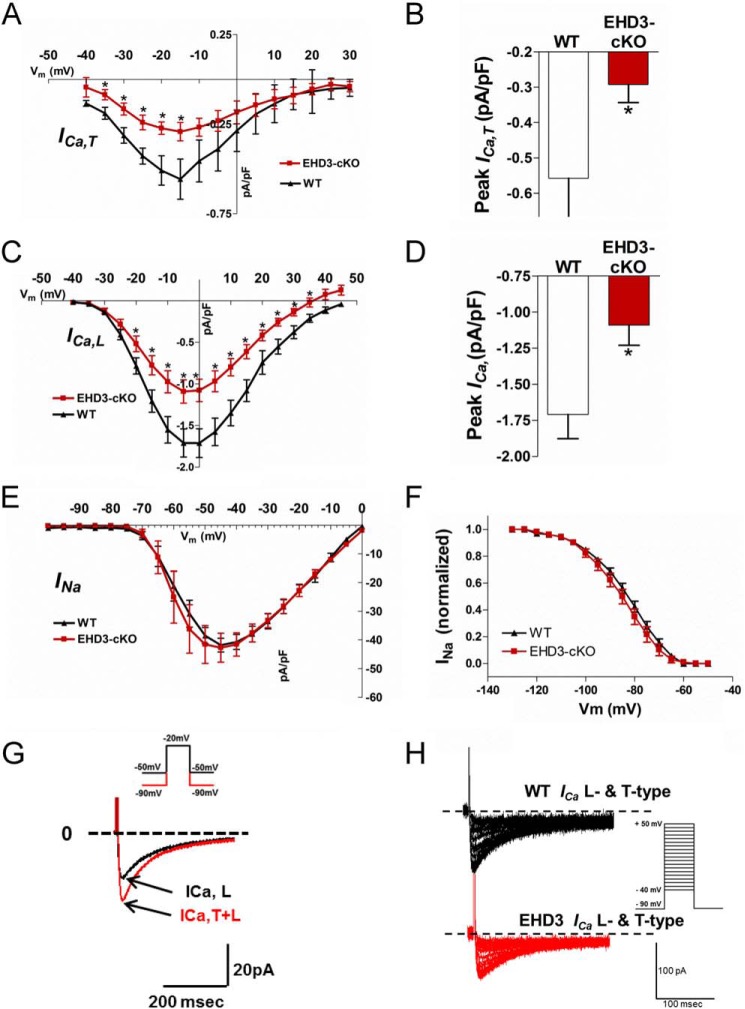
FIGURE 6.
Voltage-gated Ca2+ currents are decreased in EHD3 cKO atrial myocytes. A, current-voltage relationship of the ICa,T in WT and EHD3 cKO atrial myocytes. ICa,T is significantly different across all relevant physiologically voltages (n = 11 WT, n = 14 atria). B, peak ICa,T is significantly decreased in EHD3 cKO myocytes (−0.558 versus −0.292 pA/pF, WT versus EHD3 cKO p < 0.05). C, current-voltage relationship of the ICa,L in WT and EHD3 cKO atrial myocytes. ICa,L is significantly different across all relevant physiologically voltages (n = 11 WT, n = 14 EHD3 cKO atria). D, peak ICa,L is significantly decreased in EHD3 cKO myocytes (−1.71 versus −1.09 pA/pF, WT versus EHD3 cKO, p < 0.01). E and F, INa and INa inactivation are both unchanged by loss of EHD3 in atrial myocytes. G, representative patch clamp protocol applied to an atrial myocyte to assess ICa,T and ICa,L at a test potential of −20 mV. H, representative raw current traces of both T-type and L-type current in WT and EHD3 cKO atrial myocytes.

