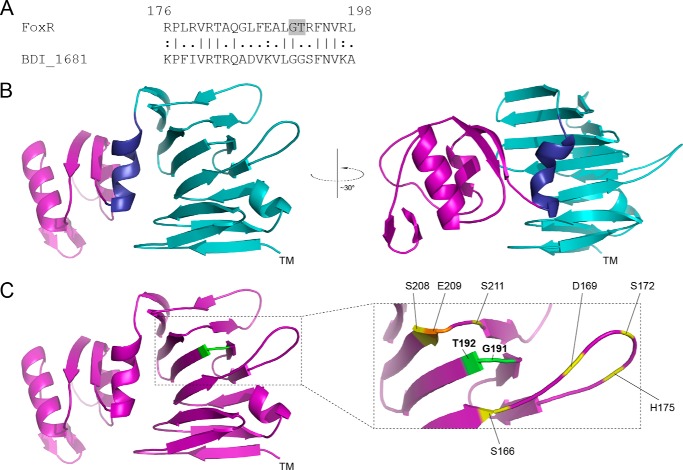
FIGURE 2.
Structural modeling of PaFoxR. A, a pair-wise alignment of the P. aeruginosa FoxR protein (residues 176–198) is shown with its homologue BDI_1681 of P. distasonis. The GT cleavage site in FoxR is shaded. B, a cartoon representation of the structural model of the periplasmic region of FoxR (FoxRperi) created using the Phyre program (32) is shown. The location of the transmembrane segment is indicated by TM. The C terminus of FoxRperi (residues 256–328) has been colored purple, and the N terminus of FoxRperi (residues 114–245) is in light blue. The helix separating these distinct regions (residues 246–255) is shown in dark blue. C, the residues flanking the self-cleavage site (Gly-191 and Thr-192) have been colored green. Residues that could be part of a putative proteolytic active site (Ser, etc.) are indicated in yellow, and Glu-209 is shown in orange (see text).

