
Fig. 3.
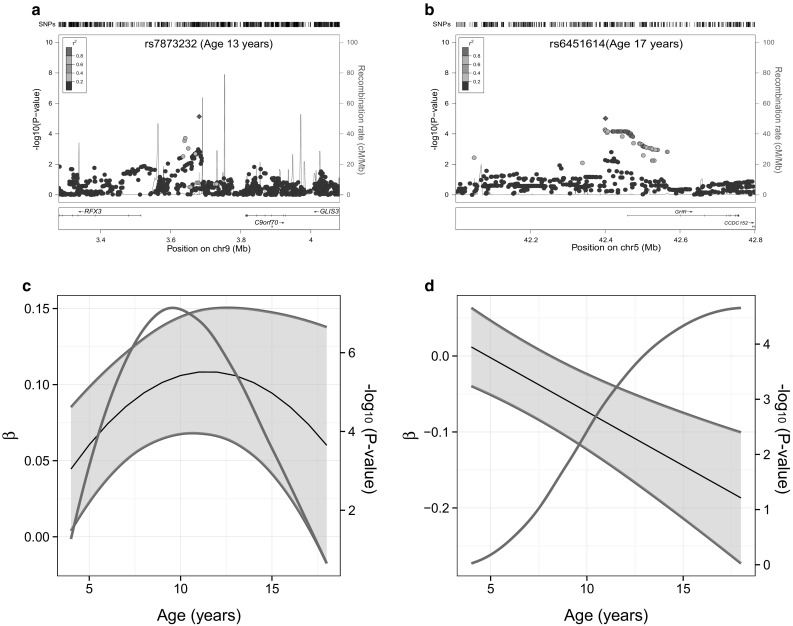
Peer problem association signals in ALSPAC. Regional association plots for rs7873232 (a) and rs6451614 (b) based on cross-sectional GWAS in ALSPAC at 13 and 17 years, respectively. The genomic position is shown in mega bases (Build 36). Recombination rates are based on HapMap CEU (Rel22) and the LD (r 2) between the lead variant and surrounding SNPs is indicated by the colour code. Developmental changes in the genetic association at rs7873232 (c) and rs6451614 (d) in ALSPAC. Longitudinal modelling was carried out with a mixed Poisson model using all available data between 4 and 17 years of age. Genetic effects (β) and their 95 % confidence intervals (black and blue lines) represent the change in log-counts of peer problems per effect allele (rs7873232_A and rs6451614_A) at different stages during development and are shown together with the strength of the genetic association (−log10 P value, red line). Genetic effects are based on linear combinations of SNP, SNP × age and/or SNP × age2 interaction effects, and longitudinal model parameters are described in Supplementary Table S9 (colour figure online)